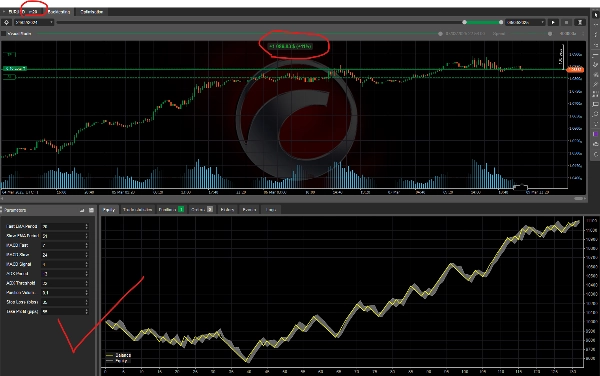
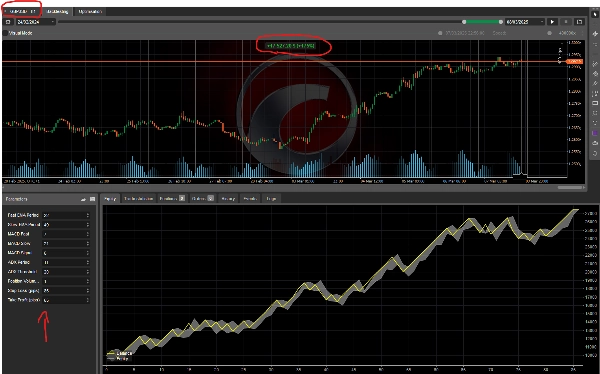
Deskripsi
Penjelasan Strategi Mengikuti Tren Forex (Bahasa Inggris)
Strategi mengikuti tren ini dirancang untuk mengidentifikasi tren pasar yang kuat menggunakan Exponential Moving Averages (EMAs), MACD, dan ADX. Ini menghasilkan sinyal beli dan jual berdasarkan momentum dan kekuatan tren.
Cara Kerjanya
1️⃣ Mengidentifikasi Arah Tren
- Fast EMA (21) dan Slow EMA (50) menentukan arah tren keseluruhan:
-
- Tren Bullish → Fast EMA berada di atas Slow EMA
- Tren Bearish → Fast EMA berada di bawah Slow EMA
2️⃣ Mengukur Momentum Tren (Histogram MACD)
- Histogram MACD mengonfirmasi momentum:
-
- Momentum Bullish → Histogram MACD berada di atas nol
- Momentum Bearish → Histogram MACD berada di bawah nol
3️⃣ Memeriksa Kekuatan Tren (Indikator ADX)
- ADX (14) mengukur kekuatan tren:
-
- Tren Kuat → ADX berada di atas 25
- Tren Lemah → ADX berada di bawah 25 (tidak ada sinyal)
Eksekusi Perdagangan
✅ Sinyal Beli (Entri Bullish)
- Fast EMA > Slow EMA (Uptrend)
- Histogram MACD > 0 (Konfirmasi momentum)
- ADX > 25 (Tren kuat)
- 🔹 Panah beli muncul di bawah harga terendah
❌ Sinyal Jual (Entri Bearish)
- Fast EMA < Slow EMA (Downtrend)
- Histogram MACD < 0 (Konfirmasi momentum)
- ADX > 25 (Tren kuat)
- 🔻 Panah jual muncul di atas harga tertinggi
Fitur Utama
✔ Menghindari tren lemah menggunakan ADX
✔ Menyaring sinyal palsu dengan konfirmasi MACD
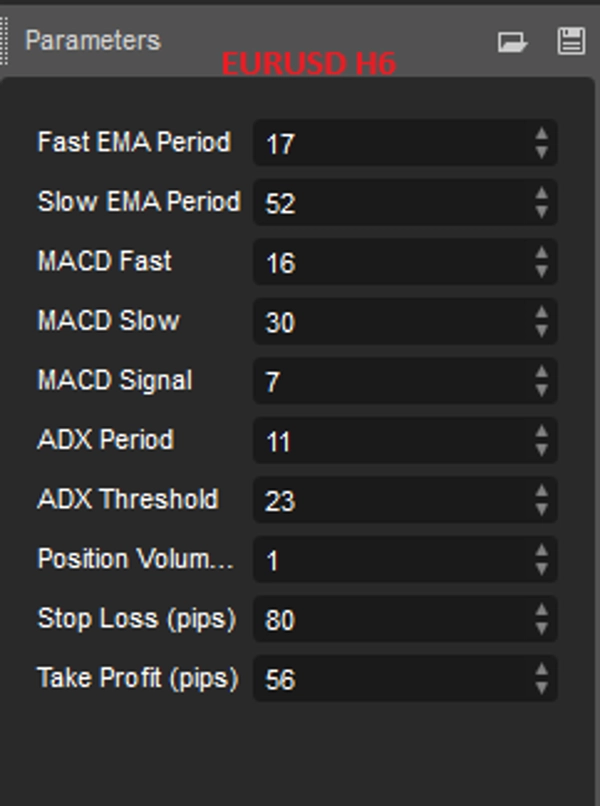
✔ Parameter yang dapat disesuaikan untuk kustomisasi lebih baik
Indikator ini membantu trader mengikuti tren kuat sambil menghindari kondisi pasar yang lemah. 🚀
Ringkasan
Key components of the strategy include:
- Trend Direction: Determined by the relationship between a fast EMA (21) and a slow EMA (50). A bullish trend is indicated when the fast EMA is above the slow EMA; a bearish trend when it is below.
- Momentum Confirmation: The MACD histogram confirms momentum, with positive values indicating bullish momentum and negative values indicating bearish momentum.
- Trend Strength: The ADX (14) measures trend strength, with values above 25 signaling a strong trend suitable for trading; values below 25 indicate weak trends where no signals are generated.
Trade execution signals:
- Buy signals occur when the fast EMA is above the slow EMA, MACD histogram is positive, and ADX is above 25. A buy arrow appears below the low price.
- Sell signals occur when the fast EMA is below the slow EMA, MACD histogram is negative, and ADX is above 25. A sell arrow appears above the high price.
The bot features adjustable parameters for customization and aims to avoid weak trends and filter false signals, helping traders focus on strong market movements.
Diskusi
Ulasan pelanggan
5 | 0 % | |
4 | 100 % | |
3 | 0 % | |
2 | 0 % | |
1 | 0 % |