Deskripsi
strategi SuperTrend**
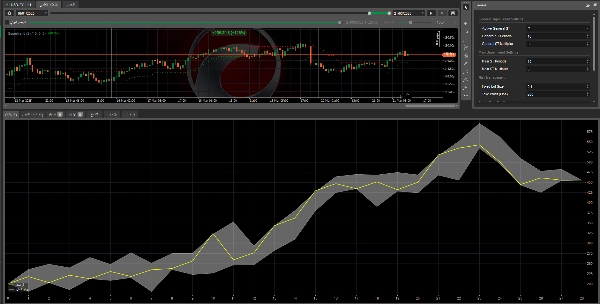
Strategi **SuperTrend** adalah strategi perdagangan populer yang didasarkan pada indikator teknis dengan nama yang sama (**Indikator SuperTrend**). Indikator ini digunakan untuk mengidentifikasi tren pasar (tren naik atau tren turun) dan memberikan sinyal masuk dan keluar yang jelas. Ini dikenal karena kesederhanaan dan efektivitasnya dalam pasar yang sedang tren.
---
### **Komponen Indikator SuperTrend**
1. **Average True Range (ATR)**:
- Digunakan untuk mengukur volatilitas pasar.
- Semakin tinggi volatilitas, semakin tinggi nilai ATR.
2. **Pengganda**:
- Faktor yang dikalikan dengan nilai ATR untuk menentukan jarak garis SuperTrend dari harga.
- Nilai default biasanya antara 2 dan 4.
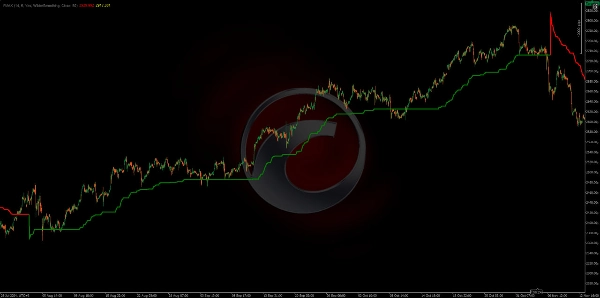
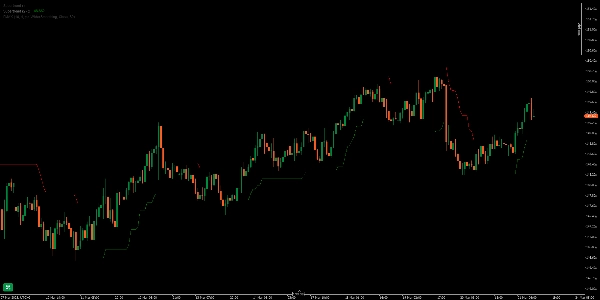
3. **Garis SuperTrend**:
- Garis dinamis yang menyesuaikan berdasarkan pergerakan harga.
- Jika harga berada di atas garis, tren dianggap bullish.
- Jika harga berada di bawah garis, tren dianggap bearish.
---
### **Bagaimana Cara Kerja Indikator SuperTrend?**
1. **Tren Naik**:
- Ketika harga berada di atas garis SuperTrend, tren dianggap bullish.
- Garis digambar di bawah harga, berfungsi sebagai dukungan dinamis.
- Sinyal Beli: Ketika harga melintasi di atas garis SuperTrend.
2. **Tren Turun**:
- Ketika harga berada di bawah garis SuperTrend, tren dianggap bearish.
- Garis digambar di atas harga, berfungsi sebagai resistensi dinamis.
- Sinyal Jual: Ketika harga melintasi di bawah garis SuperTrend.
---
### **Pengaturan Indikator**
- **Periode ATR**: Biasanya diatur ke 10 (dapat disesuaikan berdasarkan kerangka waktu).
- **Pengganda**: Biasanya diatur ke 3 (dapat disesuaikan untuk meningkatkan atau mengurangi sensitivitas).
---
### **Keuntungan Strategi SuperTrend**
1. **Mudah Digunakan**: Indikator ini sederhana dan memberikan sinyal yang jelas.
2. **Efektif di Pasar yang Sedang Tren**: Bekerja dengan baik di pasar dengan tren yang kuat.
3. **Titik Masuk dan Keluar yang Jelas**: Memberikan sinyal tepat untuk masuk dan keluar perdagangan.
4. **Dapat Disesuaikan**: Periode ATR dan pengganda dapat disesuaikan sesuai gaya perdagangan Anda.
---
### **Kekurangan Strategi SuperTrend**
1. **Tidak Efektif di Pasar Sideways**:
- Di pasar yang bergerak sideways atau range-bound, indikator ini mungkin menghasilkan sinyal palsu.
2. **Sinyal Tertinggal**:
- Seperti kebanyakan indikator pengikut tren, indikator ini mungkin tertinggal selama pergerakan harga yang cepat.
---
### **Cara Menggunakan SuperTrend dalam Perdagangan**
1. **Tambahkan Indikator ke Grafik Anda**:
- Tambahkan indikator SuperTrend ke grafik Anda.
- Sesuaikan periode ATR dan pengganda sesuai preferensi Anda.
2. **Sinyal Beli**:
- Ketika harga melintasi di atas garis SuperTrend dan garis berubah menjadi hijau, itu adalah sinyal beli.
- Tempatkan stop-loss di bawah garis SuperTrend.
3. **Sinyal Jual**:
- Ketika harga melintasi di bawah garis SuperTrend dan garis berubah menjadi merah, itu adalah sinyal jual.
- Tempatkan stop-loss di atas garis SuperTrend.
4. **Manajemen Perdagangan**:
- Gunakan garis SuperTrend sebagai panduan untuk keluar dari perdagangan.
- Tutup perdagangan ketika indikator berubah arah.
---
### **Tips untuk Meningkatkan Performa**
1. **Gabungkan dengan Alat Lain**:
- Gabungkan SuperTrend dengan indikator lain seperti **Moving Averages** atau **RSI** untuk mengonfirmasi sinyal.
2. **Sesuaikan Berdasarkan Kerangka Waktu**:
- Gunakan pengaturan yang berbeda untuk kerangka waktu harian dan yang lebih pendek.
3. **Manajemen Risiko**:
- Selalu gunakan level stop-loss dan take-profit untuk meminimalkan kerugian.
---
### **Kesimpulan**
Strategi SuperTrend adalah alat yang kuat dan efektif untuk mengidentifikasi tren dan menghasilkan sinyal perdagangan yang jelas. Namun, strategi ini harus digunakan dengan hati-hati dan dikombinasikan dengan alat lain untuk meningkatkan akurasi. Strategi ini ideal untuk trader yang lebih suka berdagang di pasar dengan tren yang kuat.