
Deskripsi
Ikhtisar
Swing Flow adalah indikator lanjutan yang mengikuti tren yang ditampilkan langsung pada grafik harga, memberikan sinyal visual yang bersih dan intuitif — mirip dengan gaya SuperTrend klasik — tetapi didukung oleh logika dasar yang berbeda dan lebih canggih.
Di mana indikator tren standar bereaksi pada setiap candle, Swing Flow mengaitkan perhitungannya pada titik ayunan pasar yang signifikan, menghasilkan garis yang benar-benar mencerminkan tren dominan dengan jauh lebih sedikit gangguan dan sinyal palsu.
Cara Kerja (Tanpa Mengungkapkan Rumus)
Swing Flow mengidentifikasi pivot tinggi dan pivot rendah yang bermakna di pasar — titik balik alami di mana harga benar-benar berbalik. Kemudian membangun level tengah dinamis dan dua pita adaptif (atas dan bawah) di sekitar pivot tersebut, menerapkan pelurusan yang disesuaikan dengan volatilitas untuk menyaring fluktuasi jangka pendek.
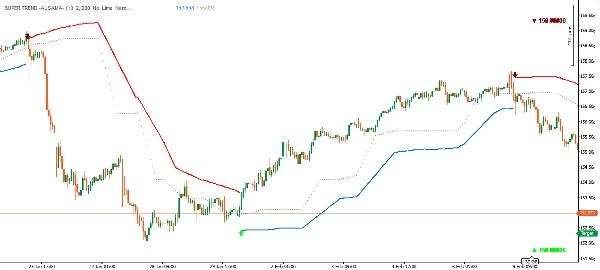
Hasilnya adalah garis tren tunggal yang ditampilkan pada grafik:
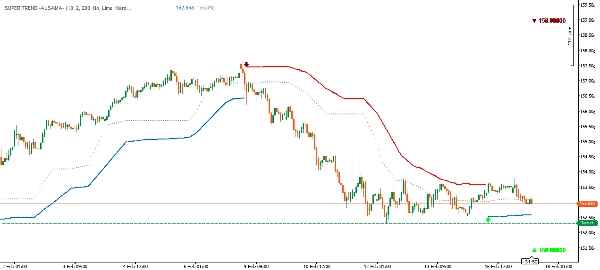
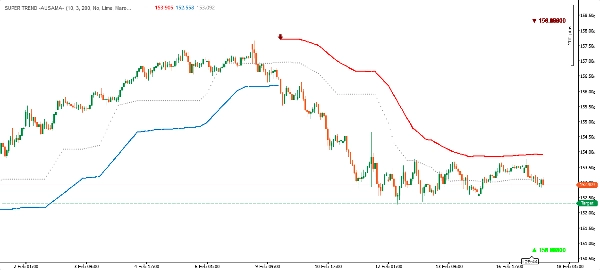
- 🟢 Garis hijau di bawah harga → Tren bullish (berfungsi sebagai dukungan dinamis)
- 🔴 Garis merah di atas harga → Tren bearish (berfungsi sebagai resistensi dinamis)
Ketika tren berbalik, garis berpindah sisi dan warna — persis seperti SuperTrend — membuatnya langsung jelas dan dapat ditindaklanjuti.
Komponen Indikator
Deskripsi Komponen
Garis Tren Utama
Garis sinyal utama — hijau di bawah harga saat tren naik, merah di atas saat tren turun
Pita Atas
Level resistensi dinamis, ditampilkan selama fase bearish
Pita Bawah
Level dukungan dinamis, ditampilkan selama fase bullish
Garis Tengah
Garis tengah adaptif yang berasal dari struktur pasar
Penanda Sinyal
Panah naik/turun dengan label harga pada setiap pembalikan tren
Label Pivot (opsional)
Penanda berlian pada swing tinggi dan rendah (dapat diaktifkan/nonaktifkan)
Keunggulan Utama
✅ Logika Berbasis Struktur
Berbeda dengan sebagian besar indikator tren yang hanya melihat aksi harga terbaru, Swing Flow dibangun berdasarkan titik pivot ayunan pasar yang sebenarnya — level yang sudah divalidasi pasar sebagai signifikan. Ini membuat sinyal tren secara fundamental lebih bermakna.
✅ Filter Volatilitas Adaptif
Pita secara otomatis menyesuaikan dengan volatilitas pasar saat ini, menyempit dalam kondisi tenang dan melebar selama periode volatil. Ini mengurangi sinyal palsu tanpa memerlukan penyetelan manual.
✅ Tampilan Bersih ala SuperTrend
Meskipun logikanya canggih, output visualnya bersih dan familiar. Satu garis pada grafik — hijau di bawah, merah di atas. Tanpa kekacauan. Langsung terbaca pada timeframe mana pun.
✅ Sinyal Masuk yang Tepat
Setiap perubahan tren ditandai dengan panah arah dan harga penutupan tepat pada bar pembalikan, memberikan titik referensi yang jelas untuk masuk posisi.
✅ Kustomisasi Warna Penuh
Warna untuk tren bullish dan bearish sepenuhnya dapat disesuaikan agar sesuai dengan gaya grafik atau preferensi pribadi Anda.
✅ Bekerja di Semua Pasar & Timeframe
Forex, indeks, komoditas, kripto — indikator ini beradaptasi secara alami dengan instrumen dan timeframe apa pun berkat desain yang sadar volatilitas.
Cara Menggunakan
Mengikuti Tren: Ikuti tren sesuai arah garis — beli saat garis berwarna hijau (di bawah harga), jual atau hindari saat garis berwarna merah (di atas harga).
Dukungan & Resistensi Dinamis: Pita aktif berfungsi sebagai level dukungan (bullish) atau resistensi (bearish) waktu nyata. Harga yang kembali ke garis tanpa menembusnya adalah sinyal kelanjutan.
Sinyal Masuk: Penanda panah (▲ / ▼) menunjukkan perubahan tren yang terkonfirmasi. Ini dapat digunakan sebagai pemicu masuk, terutama jika selaras dengan konfluensi lain pada grafik Anda.
Referensi Pivot (opsional): Aktifkan "High & Lows" untuk menampilkan titik pivot ayunan yang digunakan indikator secara internal. Berguna untuk memahami struktur pasar secara sekilas.
Swing Flow vs. SuperTrend Standar
FiturSuperTrend StandarSwing Flow
Dasar Perhitungan
Setiap candle tunggal
Pivot ayunan pasar yang tervalidasi
Gangguan Sinyal
Lebih tinggi — bereaksi pada setiap bar
Lebih rendah — berakar pada struktur
Sinyal Palsu
Lebih umum di pasar yang bergejolak
Berkurang secara signifikan
Adaptabilitas
Pengali ATR tetap
Pita yang diluruskan dengan volatilitas
Gaya Visual
Garis tunggal
Garis tunggal + pita + level tengah
Konfirmasi Masuk
Perubahan warna
Panah + label harga saat pembalikan
Visibilitas Pivot
Tidak ada
Penanda pivot opsional
Singkatnya: Swing Flow terlihat seperti SuperTrend, tetapi berpikir seperti trader aksi harga.
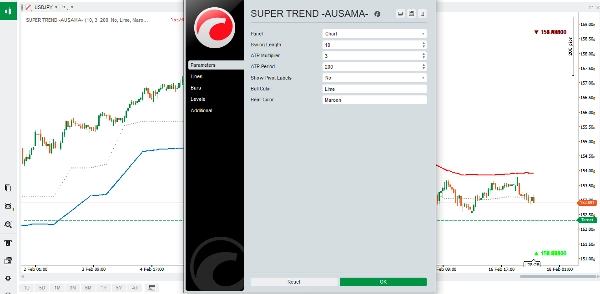
Parameter Masukan
ParameterDefaultDeskripsi
Panjang Ayunan
10
Mengontrol sensitivitas deteksi pivot
Pengali ATR
2.0
Lebar pita relatif terhadap volatilitas
Periode ATR
200
Jangka waktu pengukuran volatilitas
Tampilkan Label Pivot
Mati
Mengaktifkan/mematikan penanda swing tinggi/rendah pada grafik
Warna Bull
Lime
Warna untuk tren bullish
Warna Bear
Maroon
Warna untuk tren bearish
Tips untuk Hasil Terbaik
- Panjang Ayunan Lebih Rendah (5–8): Lebih sensitif, lebih banyak sinyal — cocok untuk scalping atau trading aktif.
- Panjang Ayunan Lebih Tinggi (14–20): Lebih sedikit, sinyal berkualitas tinggi — cocok untuk swing trading atau position trading.
- Tingkatkan Pengali ATR di pasar yang sangat volatil (misalnya, kripto) untuk menghindari pembalikan palsu.
- Turunkan Pengali ATR di pasar yang stabil dan tren untuk sinyal yang lebih ketat.
- Sebaiknya digunakan dengan konfirmasi tren dari timeframe yang lebih tinggi.
Swing Flow — Tempat struktur pasar bertemu dengan kejelasan tren.


