
Descrizione
// ══════════════════════════════════════ ══════════════════════════════════════
// 📊 INDICATORE EMA SU TF (MULTI-TIMEFRAME)
// Versione: 1.0.0 - Indicatore professionale per l'analisi multi-timeframe
// Autore: Fury Team - Armando Brecciaroli
// Data: 5 giugno 2025
// ══════════════════════════════════════════════════════════════════════════
//
// DESCRIZIONE:
// ===========
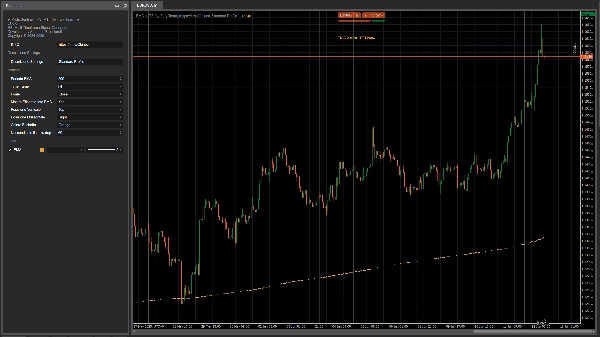
// EMA su TF è un indicatore avanzato che mostra la media mobile esponenziale
// (EMA) calcolata su un timeframe specifico e proiettata sul
// timeframe corrente del grafico. Questo strumento permette di utilizzare medie mobili di timeframe superiori
// (es. H4, D1) anche su grafici con timeframe inferiori (M15, H1),
// consentendo un'analisi multi-timeframe completa e immediata.
//
// CARATTERISTICHE PRINCIPALI:
// ==========================
// - Visualizzazione dell'EMA di qualsiasi timeframe sul grafico corrente
// - Supporto completo per tutti i timeframe disponibili in cTrader
// - Personalizzazione completa del periodo EMA e della fonte del prezzo
// - Gestione dell'etichetta informativa con posizionamento flessibile
// - Sistema di licenza sicuro e controllo automatico degli aggiornamenti
// - Ottimizzato per alte prestazioni anche su grandi serie di dati
// - Personalizzazione completa dell'aspetto visivo (colori, stile linea)
//
// USI PRATICI:
// ================
// - Identificare la tendenza a lungo termine su grafici a timeframe inferiori
// - Visualizzare medie significative di timeframe superiori
// - Creare strategie multi-timeframe basate su medie mobili
// - Identificare supporti e resistenze dinamiche più affidabili
//
// REGISTRO DELLE MODIFICHE:
// =========
// v1.0.0 (05/06/2025)
// - Rilascio iniziale con supporto completo per tutti i timeframe
// - Implementazione di un sistema avanzato di gestione delle licenze
// - Interfaccia utente personalizzabile con HUD informativo
// - Aggiunta etichetta informativa sul grafico
// - Sistema di aggiornamento automatico integrato
// - Ottimizzazione delle prestazioni per serie temporali estese
// - Supporto per tutte le fonti di prezzo (Close, Open, High, Low, ecc.)
// - Gestione automatica della visualizzazione dei messaggi di sistema
// ═══════════════════════════════════════════════════════════════════════════════
Per abilitare la licenza segui le informazioni sullo schermo o nei log.
Riepilogo
Recensioni dei clienti
5 | 0 % | |
4 | 100 % | |
3 | 0 % | |
2 | 0 % | |
1 | 0 % |


