Açıklama
ZLEMA (Sıfır Gecikmeli Üssel Hareketli Ortalama), geleneksel EMA'larla yaygın olarak ilişkilendirilen gecikmeyi azaltmak için tasarlanmış Üssel Hareketli Ortalama'nın (EMA) gelişmiş bir versiyonudur. Özel bir hesaplama yöntemi kullanarak, ZLEMA fiyat değişikliklerine daha hızlı tepki verir ve bu da onu özellikle volatil piyasalarda etkili kılar.
ZLEMA'nın temel özelliği "sıfır gecikme" karakteristiğidir; bu sayede özellikle hızlı hareket eden piyasa koşullarında fiyat hareketlerini daha yakından takip edebilir. Geleneksel EMA ile karşılaştırıldığında, ZLEMA daha hızlı tepki süreleri sunar ve piyasa trendlerini yakalamada daha zamanında olur.
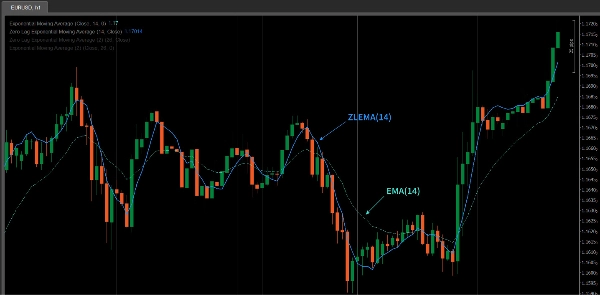
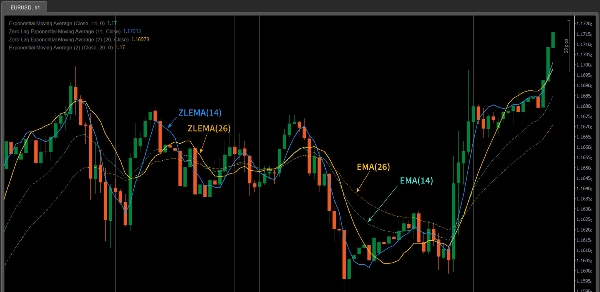
ZLEMA ve EMA Karşılaştırması
- Tepki Hızı: ZLEMA, geleneksel EMA'dan daha hızlı tepki verir. Gecikmeyi telafi ederek fiyat değişikliklerini daha çabuk takip eder.
- Yumuşatma Etkisi: ZLEMA, EMA'ya benzer bir yumuşatma etkisi sağlar ve fiyat gecikmesini en aza indirerek hızlı hareket eden piyasalara daha uygun hale gelir.
- Kullanım Alanı: Eğer yüksek volatiliteye sahip bir piyasada işlem yapıyorsanız (örneğin kısa vadeli veya gün içi işlemler), ZLEMA tepki hızı açısından EMA'dan daha iyi performans gösterebilir.
ZLEMA Göstergesinin Özellikleri
- Sıfır Gecikmeli Tepki: ZLEMA gecikmeyi azaltır, böylece piyasa fiyat dalgalanmalarına hızlı tepki verebilir ve hızlı piyasa değişimlerini yakalamada daha doğru olur.
- Yumuşaklık: Daha hızlı tepki sunmasına rağmen, ZLEMA EMA'nın yumuşatma etkisini korur ve fiyat dalgalanmalarından kaynaklanan gürültüyü önlemeye yardımcı olur.
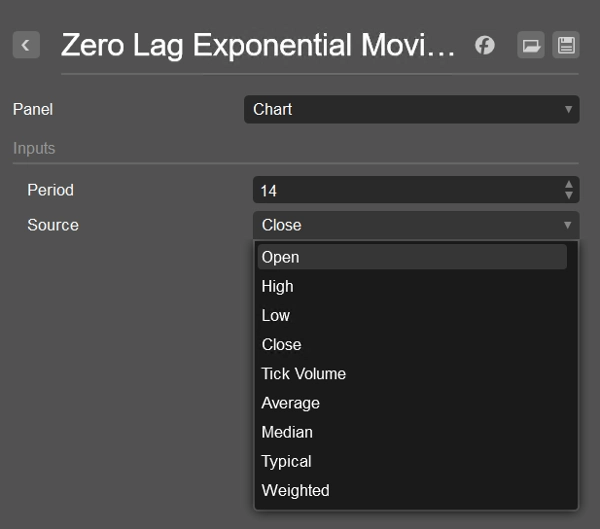
- Esneklik: ZLEMA farklı fiyat veri kaynaklarıyla kullanılabilir (örneğin
Close,Open,Highvb.), böylece yatırımcılar strateji ihtiyaçlarına göre ayarlama yapabilirler. - Trend Takibi ve Dönüş Sinyali Onayı: ZLEMA, özellikle volatil piyasalarda trend değişikliklerini belirlemek ve fiyat dönüş sinyallerini onaylamak için idealdir.
ZLEMA Göstergesinin Kullanımı
- Kısa Vadeli Yatırımcılar: ZLEMA, fiyat dalgalanmalarına hızlı tepki verebildiği için kısa vadeli yatırımcılar için mükemmeldir. Hızlı tepkisi, kısa vadeli trend dönüşlerini veya kırılma sinyallerini yakalamada idealdir.
- Trend Takibi: ZLEMA uzun vadeli trendleri takip etmek için de kullanılabilir ancak EMA'dan daha hassastır. Güçlü bir trendde, ZLEMA trendlerin başlangıcını veya sonunu daha hızlı belirlemeye yardımcı olur ve zamanında strateji ayarlamalarını destekler.
- Diğer Göstergelerle Kombinasyon: ZLEMA, RSI, MACD veya fiyat formasyonu analizi gibi diğer teknik göstergelerle birleştirildiğinde sinyal doğruluğunu artırır. Özellikle hareketli ortalamalar gibi trend takip göstergeleriyle birlikte kullanıldığında fiyat kırılmalarını veya dönüşlerini onaylamak için faydalıdır.
- Kırılma ve Dönüşlerin Onayı: ZLEMA, önemli seviyelerden fiyat kırılmalarını veya dönüş sinyallerini onaylamaya yardımcı olabilir. Örneğin, fiyat ZLEMA çizgisini geçtiğinde bu bir trend değişikliğini gösterebilir ve tersi de geçerlidir.
- Gürültü Azaltma: Azaltılmış gecikmesi sayesinde, ZLEMA geleneksel hareketli ortalamalarda bulunabilecek gürültüyü daha iyi filtreler ve bu da onu gün içi işlemler veya yüksek volatiliteye sahip piyasalarda önemli bir araç yapar.
ZLEMA Kullanım İpuçları
- Periyodu Ayarlayın: ZLEMA periyodunu işlem tarzınıza ve piyasa volatilitesine göre ayarlayın. Kısa vadeli işlemler için daha kısa bir periyot (örneğin 10 veya 14), uzun vadeli trend takibi için ise daha uzun bir periyot (örneğin 50 veya 100) daha uygun olabilir.
- Diğer Araçlarla Kombine Edin: ZLEMA mükemmel trend takip yetenekleri sağlasa da, aşırı alım/aşırı satım koşulları için RSI veya trend gücü için MACD gibi diğer göstergelerle birleştirilmesi doğruluğu artırabilir.
- Test ve Optimizasyon: ZLEMA'nın performansı farklı piyasa koşullarında değişebilir. Canlı işlemde kullanmadan önce stratejinizde en iyi sonuçları almak için kapsamlı geri test ve optimizasyon yapmanız önerilir.
Özet
Key features include:
- Zero lag response for timely reaction to price fluctuations.
- Smoothness that filters out noise without sacrificing responsiveness.
- Flexibility to use various price data inputs such as Close, Open, or High prices.
- Utility in trend following and confirming reversal signals.
ZLEMA is particularly useful for short-term traders seeking to capture rapid trend reversals or breakouts, as well as for longer-term trend tracking with enhanced sensitivity compared to EMA. It can be combined with other indicators like RSI or MACD to improve signal accuracy and confirm price breakouts or reversals.
Users can adjust the indicator’s period to match their trading style and market conditions, optimizing performance through backtesting. ZLEMA helps reduce noise and lag, making it a valuable tool for intraday and volatile market trading.