
Descrizione
**Vmm Signal Trend Pro - Indicatore per cTrader**
**Descrizione Generale**
Vmm Signal Trend Pro è un indicatore di analisi tecnica avanzata per la piattaforma cTrader che rileva molteplici pattern di prezzo in tempo reale. Combina il rilevamento del trend, i pattern di candlestick, FVG (Fair Value Gaps), gap e altri pattern importanti in un unico indicatore visivo.
**Caratteristiche Principali**
**1. Rilevamento del Trend**
- **Analisi Price Action**: Identifica i trend attraverso l’azione del prezzo sulle ultime N candele
- **Forza del Trend**: Calcola la percentuale di forza basata su momentum e struttura
- **Icone Direzionali**: Freccia verde (su) o freccia rossa (giù) quando il trend è forte
**2. Pattern Rilevati**
**Fair Value Gap (FVG)**
- **FVG Rialzista**: Quando il minimo attuale > il massimo di 2 candele fa
- **FVG Ribassista**: Quando il massimo attuale < il minimo di 2 candele fa
- **Aree Colorate**: Rettangoli semi-trasparenti (verde/arancione)
**Gap**
- **Gap Rialzista**: Apertura sopra il massimo precedente
- **Gap Ribassista**: Apertura sotto il minimo precedente
- **Visualizzazione**: Piccoli rettangoli all’apertura della candela
**Inside Bars**
- Candela completamente all’interno del range della candela precedente
- Differenziazione per colore (giallo/arancione) basata sulla direzione
**Pattern 123 (Inversione)**
- **Pattern 123 Rialzista**: Tre punti con breakout verso l’alto
- **Pattern 123 Ribassista**: Tre punti con breakout verso il basso
- **Segnalazione**: Icona circolare Oro
**Pattern Wick**
- **Simile a Martello**: Wick inferiore significativo
- **Simile a Stella Cadente**: Wick superiore significativo
- **Icona**: Stella Magenta
**Pin Bars**
- Wick lungo (≥2x corpo) con corpo piccolo
- Rilevamento di livelli chiave vicini
- **Icone**: Triangolo su/giù (ciano)
**Engulfing**
- **Engulfing Rialzista**: Candela rialzista che ingloba la precedente ribassista
- **Engulfing Ribassista**: Candela ribassista che ingloba la precedente rialzista
- **Icona**: Diamante Viola
**Doji**
- Corpo molto piccolo (≤10% del range totale di default)
- Tipi speciali: Gravestone, Dragonfly, Long-Legged
- **Icona**: Cerchio Grigio
**3.** Sistema di Supporto/Resistenza**
- Rilevamento automatico di massimi/minimi swing
- Considera la prossimità ai livelli chiave per aumentare la rilevanza
**4. Filtraggio Intelligente**
- **Limite per Tipo**: Numero massimo di segnali per categoria
- **Spaziatura Temporale**: Evita segnali troppo ravvicinati
- **Filtro Trend**: Opzione per consentire/negare segnali contro-trend
- **Forza Minima**: Filtra segnali deboli
**Parametri Configurabili**
**Essenziali**
- `Mostra Direzione Trend`: Attiva le frecce del trend
- `Controllo Candele Precedenti`: Numero di candele per l’analisi
- `Soglia Forza Trend`: Percentuale minima per considerare un trend forte
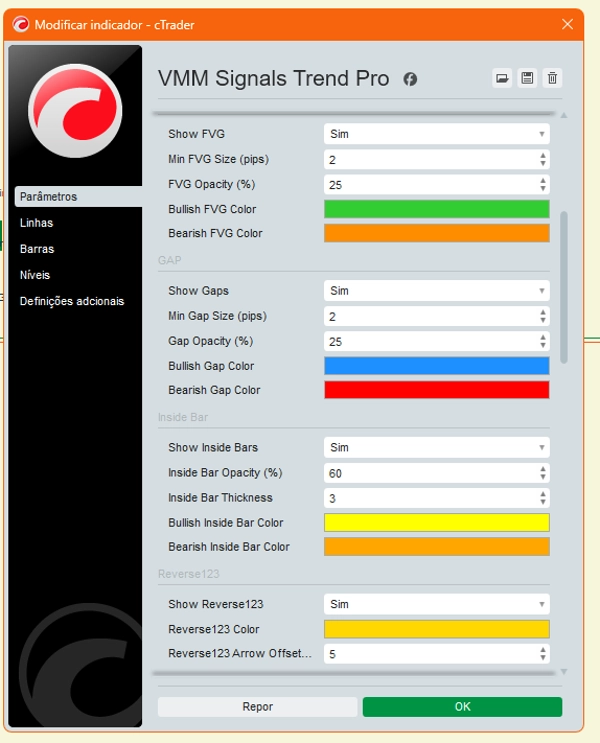
**FVG**
- `Dimensione Minima FVG`: Dimensione minima in pips
- `Opacità`: Trasparenza delle aree
- `Colori`: Colori personalizzabili
**Gap**
- `Dimensione Minima Gap`: Dimensione minima in pips
- `Colori`: Colori per gap rialzisti/ribassisti
**Inside Bars**
- `Spessore`: Spessore della linea
- Opacità: Trasparenza
- Colori: Colori differenziati per direzione
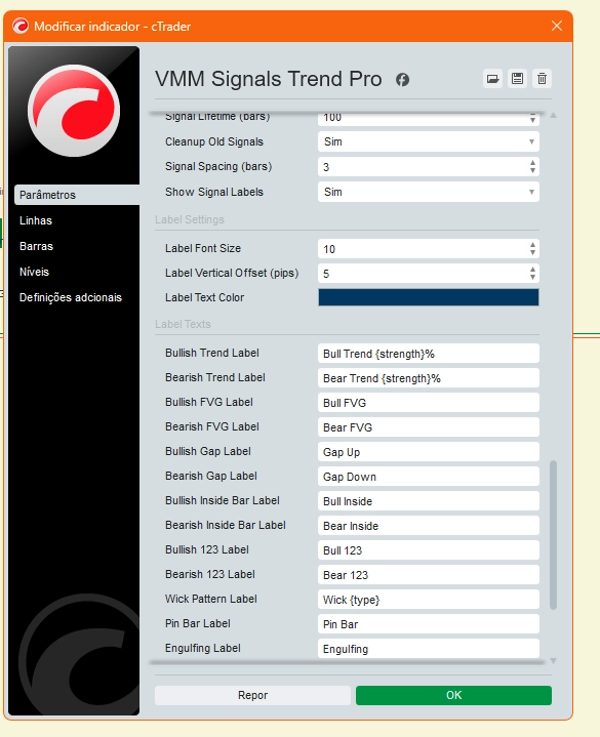
Segnali:
- Durata Segnale: Durata del segnale (in candele)
- Spaziatura Segnali: Spaziatura minima tra segnali
- Max Segnali Per Tipo: Limite per categoria
Etichette Personalizzate:
- Testo Personalizzabile: Ogni pattern ha il proprio testo configurabile
- Segnaposto: `{strength}` per % di forza, `{type}` per tipo specifico
- Formattazione: Dimensione font, offset verticale, colori
- Modalità Breve: Etichette abbreviate per grafici densi
Meccaniche Interne:
1. Analisi del Trend:
- Regressione Lineare: Calcola la pendenza del trend
- Conteggio Candele: Rialziste vs. Ribassiste negli ultimi N periodi
- Momentum: Considera l’entità dei movimenti
2. Gestione Oggetti**
- **Cache Oggetti**: Previene il ridisegno di segnali esistenti
- **Pulizia Automatica**: Rimuove segnali vecchi basati sulla durata
- **Contatori per Tipo**: Controlla la quantità massima
**3. **Calcolo della Forza**
- Ogni pattern ha una formula specifica per la forza
- Basata su rapporti, distanze in pip, prossimità a livelli chiave
- Intervallo: 0-100%
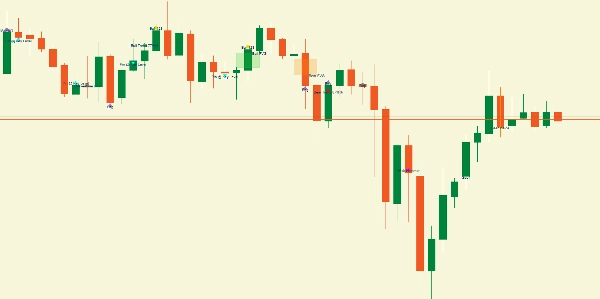
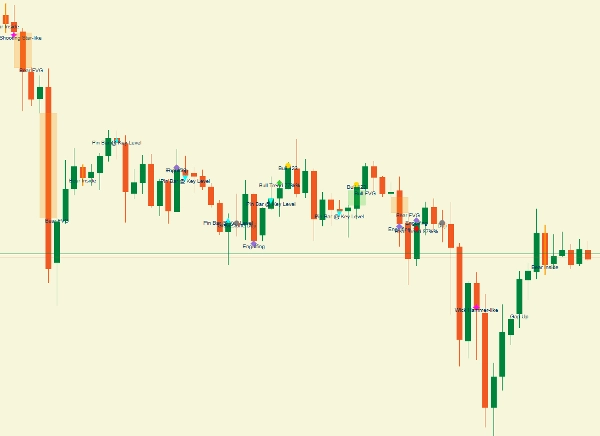
**Visualizzazione sul Grafico**
**Elementi del Grafico**
1. **Icone**: Frecce, triangoli, cerchi, diamanti, stelle
2. **Aree**: Rettangoli semi-trasparenti (FVG/Gap)
3. **Linee**: Inside bars evidenziate
4. **Etichette**: Testo informativo accanto ai segnali
**Codice Colori**
- **Verde**: Rialzista (trend, FVG, gap)
- **Rosso/Arancione**: Ribassista (trend, FVG, gap)
- **Giallo/Arancione**: Inside bars (rialzista/ribassista)
- **Oro**: Pattern 123
- **Magenta**: Pattern Wick
- **Ciano**: Pin bars
- **Viola**: Engulfing
- **Grigio**: Doji
**Vantaggi**
**Per i Trader**
- **Tutto in uno**: Molteplici pattern in un unico indicatore
- **Personalizzabile**: Regolazione fine di ogni pattern
- **Visuale Chiara**: Codifica colore intuitiva
- **Filtraggio**: Previene sovraccarico di segnali
**Casi d'Uso**
**1. Analisi Rapida**
- Identificare il trend prevalente
- Controllare FVG e gap recenti
- Rilevare pattern di inversione
**2. Conferma di Entrata**
- Combinare più pattern per aumentare la probabilità
- Verificare l’allineamento con il trend
- Considerare la forza del segnale
**3. Gestione del Rischio**
- Identificare livelli di supporto/resistenza vicini
- Usare FVG come aree di interesse
- Considerare la spaziatura dei segnali
**Limitazioni**
**Dipendenze**
- **Mercati volatili**: Può generare molti segnali
- **Timeframe**: Le impostazioni potrebbero necessitare di aggiustamenti per timeframe diversi
- **Asset**: Il comportamento varia a seconda della coppia di valute
**Considerazioni**
- **Non predittivo**: I pattern passati ≠ garanzia futura
- **Conferma richiesta**: Confermare sempre con analisi aggiuntive
- **Falsi segnali**: I filtri riducono ma non eliminano
**Raccomandazioni d'Uso**
**Impostazioni Iniziali**
1. Iniziare con `Smart Filtering = true`
2. Regolare `Min Signal Strength` secondo il proprio stile
3. Usare `Signal Spacing` per evitare sovraccarico
4. Personalizzare i colori per una migliore visualizzazione
**Combinazioni Efficaci**
- **Trend + FVG**: Allineamento forte
- **Inside bar + Livello chiave**: Buona area di entrata
- **Pin bar + Engulfing**: Conferma di inversione
- **123 + Trend**: Probabile continuazione
**Monitoraggio**
- Controllare periodicamente i log nella console
- Regolare i parametri in base al mercato
- Usare in combinazione con altri indicatori
Questo indicatore è uno strumento completo per i trader che cercano un’analisi tecnica esaustiva focalizzata sull’azione del prezzo e sui pattern visivi, offrendo totale flessibilità nella personalizzazione e nel filtraggio dei segnali.
**⚠️ AVVISO IMPORTANTE**
Questo indicatore è uno STRUMENTO DI ANALISI TECNICA. I segnali generati sono SUGGERIMENTI basati su algoritmi, NON raccomandazioni di investimento. Il trading comporta un rischio significativo di perdita. Le performance passate non garantiscono risultati futuri. Il trader è INTERAMENTE RESPONSABILE di tutte le decisioni di trading. Usare sempre una corretta gestione del rischio e testare su conti demo prima del trading reale.


![Logo di "Wyckoff Toolkit [Iridio Capital]"](https://cdn.ctrader.com/image/webp/8acfe6a1-6a8e-4578-9367-9df3af2b1801_27763)


