
Deskripsi
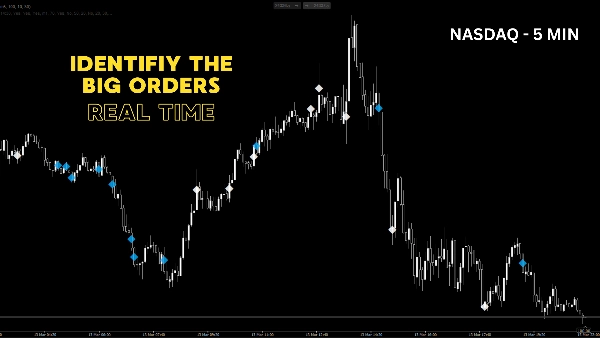
Abnormal Volume Clusters adalah alat analisis volume presisi tinggi untuk cTrader yang dirancang untuk mengungkap jejak institusional dan aktivitas perdagangan ekstrem. Volume mendahului harga, dan indikator ini menunjukkan dengan tepat di mana "uang pintar" masuk ke pasar.
Alih-alih mengandalkan ambang volume tetap dan statis, indikator ini menggunakan logika persentil bergulir dinamis. Ini menganalisis riwayat terbaru dan hanya menyoroti candle yang volumenya benar-benar abnormal (misalnya, 5% teratas bar volume tertinggi selama 200 periode terakhir).
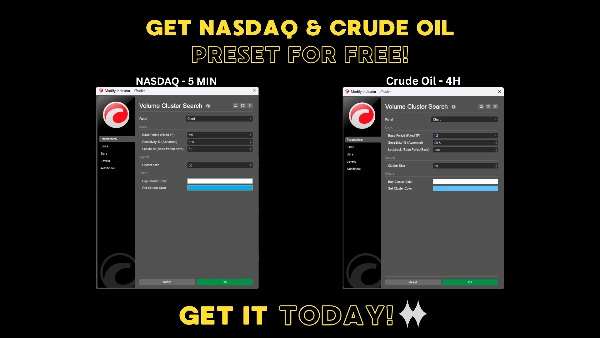
Keunggulan besar adalah kemampuan Multi-Timeframe (MTF): Anda dapat berdagang pada grafik 5 menit sementara indikator secara diam-diam memantau "Periode Dasar" yang lebih tinggi (seperti grafik 1 jam) untuk lonjakan volume, memproyeksikan klaster penting tersebut langsung ke grafik timeframe lebih rendah Anda tepat di tempat mereka terjadi.
🔥 Fitur Utama:
- Sensitivitas Dinamis: Menggunakan ambang persentil bergulir (misalnya, 95%) sehingga secara otomatis menyesuaikan dengan kondisi pasar yang tenang maupun sangat volatil.
- Multi-Timeframe Sejati: Menyaring kebisingan pasar dengan menggunakan timeframe dasar yang lebih tinggi, sambil menjaga entri Anda tetap sangat akurat pada timeframe yang lebih rendah.
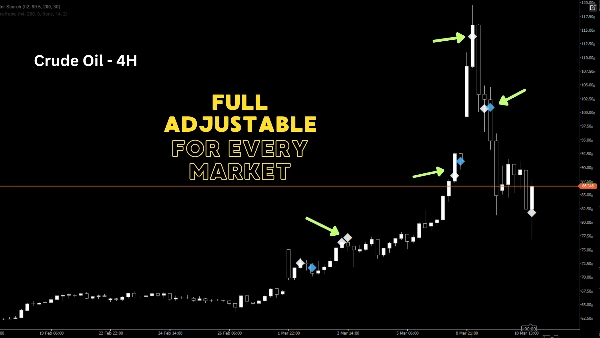
- Klaster Arah: Peristiwa volume ekstrem diplot sebagai penanda berlian (◆) tepat di harga median. Hijau untuk penutupan bullish, Merah untuk penutupan bearish.
- Sangat Dioptimalkan: Manajemen memori bawaan (maks 2000 objek yang digambar) memastikan platform cTrader Anda tetap sangat cepat.
- Sepenuhnya Dapat Disesuaikan: Sesuaikan periode Lookback, Sensitivitas (%), Timeframe Dasar, Ukuran Klaster, dan Warna agar sesuai dengan gaya trading pribadi Anda.
💡 Cara menggunakannya?
Volume abnormal biasanya menunjukkan salah satu dari dua hal: Inisiasi tren besar (breakout) atau kapitulas/absorpsi (reversal). Dengan mengenali klaster ini, Anda dapat mengidentifikasi zona support dan resistance tersembunyi berdasarkan modal yang benar-benar diperdagangkan, bukan hanya aksi harga. Sempurna untuk Day Trader, Scalper, Swing Trader, dan Volume Action Trader yang mencari keunggulan nyata.
Ringkasan
Ulasan pelanggan
5 | 0 % | |
4 | 67 % | |
3 | 33 % | |
2 | 0 % | |
1 | 0 % |


