Descripción
Indicador de Patrón Martillo – Explicación de la Estrategia
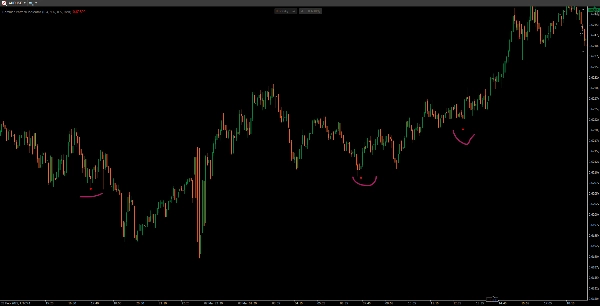
Este Indicador de Patrón Martillo es una señal de reversión basada en velas japonesas que identifica patrones de martillo alcistas en una tendencia bajista. Está diseñado para detectar posibles reversiones de tendencia y resaltar oportunidades de compra.
Cómo Funciona
1️⃣ Detecta Tendencia Bajista
- El precio de cierre de la vela debe ser inferior al cierre de hace 3 barras, indicando una posible tendencia bajista.
2️⃣ Valida la Estructura de la Vela Martillo
- Cuerpo Pequeño: El cuerpo de la vela es relativamente pequeño (≤ 30% del rango total).
- Sombra Inferior Larga: La mecha inferior es al menos 2 veces el tamaño del cuerpo (muestra un fuerte rechazo a precios más bajos).
- Sombra Superior Corta: La mecha superior es ≤ 30% del tamaño del cuerpo (indicando poca resistencia en la parte superior).
3️⃣ Genera una Señal de Compra
- Si se cumplen todas las condiciones, aparece un punto rojo (o un color elegido) ligeramente debajo del mínimo de la vela martillo como confirmación visual de una posible reversión.
Características Clave
✅ Filtra señales débiles asegurando una tendencia bajista previa.
✅ Parámetros personalizables para tamaño del cuerpo, longitud de las sombras y colores.
✅ Patrón de vela sencillo pero efectivo para traders de swing y traders de acción del precio.
📌 Mejor Uso: ¡Confirma el patrón martillo con indicadores adicionales (p. ej., volumen, niveles de soporte) para señales más fuertes! 🚀
Resumen
Valoraciones de clientes
5 | 100 % | |
4 | 0 % | |
3 | 0 % | |
2 | 0 % | |
1 | 0 % |