
설명
Meravith Auto는 Meravith 수동 거래 시스템의 자동화 버전입니다.
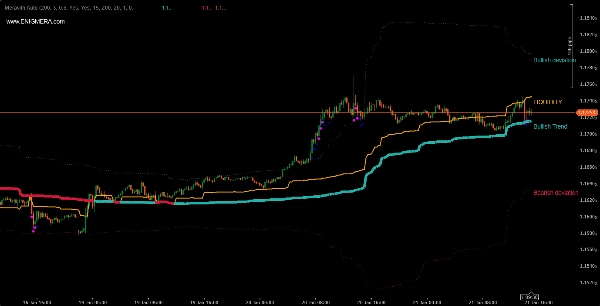
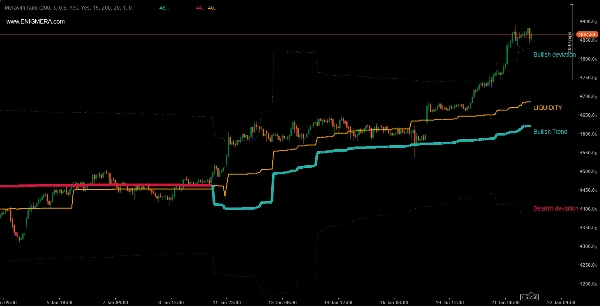
지표는 다음으로 구성됩니다:
- 색상이 변하는 추세선. 강세일 때는 녹색, 약세일 때는 빨간색입니다. 이것이 추세 지지선입니다.
- 강세 거래량과 약세 거래량이 같은 유동성선.
- 세 배 강세 편차선.
- 세 배 약세 편차선.
- 높은 거래량을 나타내는 보라색 및 파란색 점. 보라색 점은 평균 거래량에서 두 배 편차 이상인 거래량을 나타내며, 파란색 점은 두 배 편차를 나타냅니다.
사용 방법은?
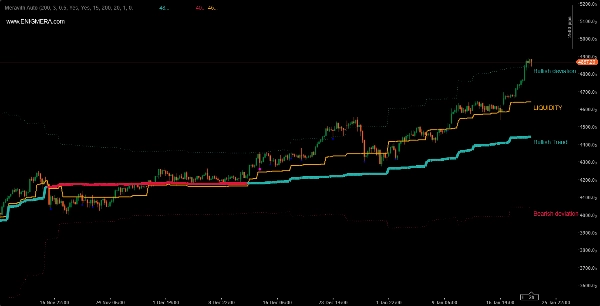
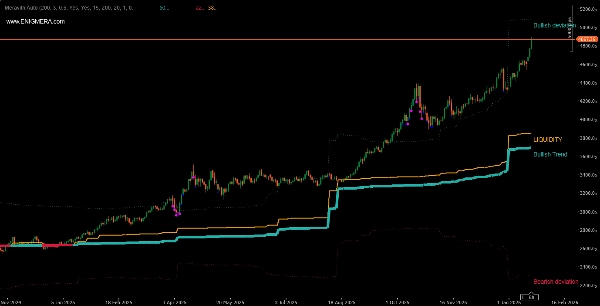
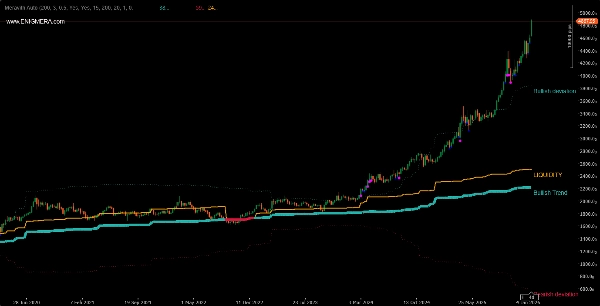
- 강세 추세선과 추세선 위의 유동성은 강세 추세를 의미합니다. 시장이 상승할 것으로 예상합니다. 롱 포지션을 엽니다.
- 약세 추세선과 추세선 아래의 유동성은 약세 추세를 의미합니다. 시장이 하락할 것으로 예상합니다. 숏 포지션을 엽니다.
다른 지표와 자유롭게 결합하여 사용하세요.
어떤 통화쌍과 어떤 시간대에서도 사용할 수 있습니다.
브로커마다 인용하는 거래량이 다르기 때문에 결과가 다를 수 있습니다.
거래량이 더 높은 대형 브로커가 더 선호됩니다.
자동화 버전과 수동 버전의 차이점은 무엇인가요?
- 수동 버전에서는 고점과 저점을 기반으로 한 추세 평가가 있습니다. 이에 따라 시장 내 거래량 소진 수준도 제공합니다.
- 자동화 버전에서는 다양한 시장 단계에 따라 변하는 기간이 있습니다. 변동성이 높을 때는 짧고, 낮을 때는 긴 기간으로 변할 수 있습니다. 여기에는 추세가 분석되지 않고 기간만 분석되기 때문에 소진 수준이 없습니다. 이것이 편차가 존재하는 이유입니다. 기본적으로 세 배 편차가 표시됩니다.
요약
지표 프로필
고객 리뷰
0.0
리뷰: 0
고객 리뷰
이 상품에 대한 리뷰가 아직 없습니다. 이미 사용해 보셨나요? 다른 사람들에게 가장 먼저 소개해 주세요!
상담
자주 묻는 질문(FAQ)
BTCUSD
Forex
Signal
Breakout
Indices
EURUSD
Commodities
GBPUSD
NZDUSD
Prop
Scalping
Crypto
Stocks
XAUUSD
NAS100
USDJPY
VWAP
트레이딩 봇, 지표, 플러그인 등 cTrader Store에서 제공되는 상품은 제3자 개발자에 의해 제공되며, 이는 단순히 정보 및 기술적 접근을 목적으로 제공된 것입니다. cTrader Store는 중개인이 아니며, 투자 조언, 개인별 추천 또는 향후 성과에 대한 어떠한 보장도 제공하지 않습니다.
좋아하실 만한 다른 항목

!["Wyckoff Toolkit [Iridio Capital]" 로고](https://cdn.ctrader.com/image/webp/8acfe6a1-6a8e-4578-9367-9df3af2b1801_27763)


가격
가입일 24/10/2025