present
Registe-se e receba 50 $ de desconto na sua primeira compra
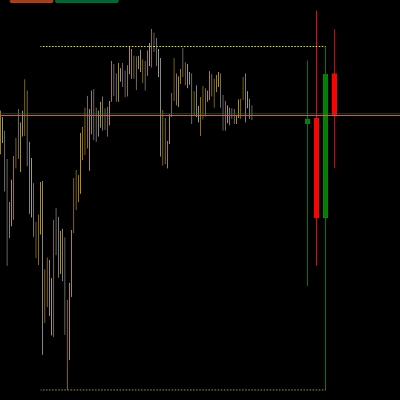
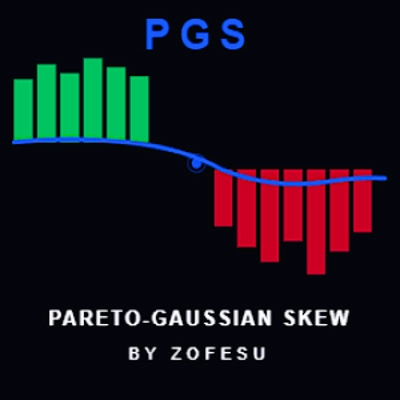
Trading product for PGS - Pareto Gaussian Skew by Zofesu Indicador EMA Supertrend, image 1
PGS - Pareto Gaussian Skew by Zofesu
Indicador
Versão 1.0, May 2026
Windows, Mac
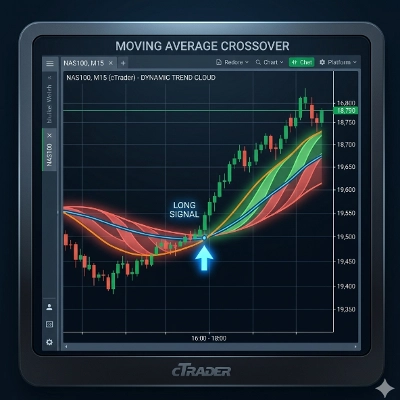
Trading product for PGS - Pareto Gaussian Skew by Zofesu Indicador EMA Supertrend, image 2
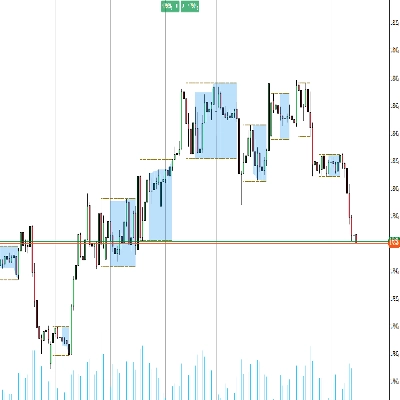
Trading product for PGS - Pareto Gaussian Skew by Zofesu Indicador EMA Supertrend, image 3
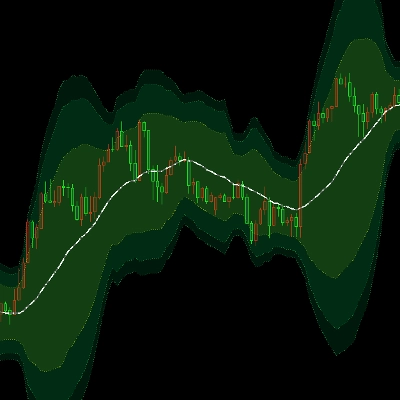
Trading product for PGS - Pareto Gaussian Skew by Zofesu Indicador EMA Supertrend, image 4
Trading product for PGS - Pareto Gaussian Skew by Zofesu Indicador EMA Supertrend, image 5
Trading product for PGS - Pareto Gaussian Skew by Zofesu Indicador EMA Supertrend, image 6
Desde 01/12/2025
280
Instalações gratuitas

Descrição

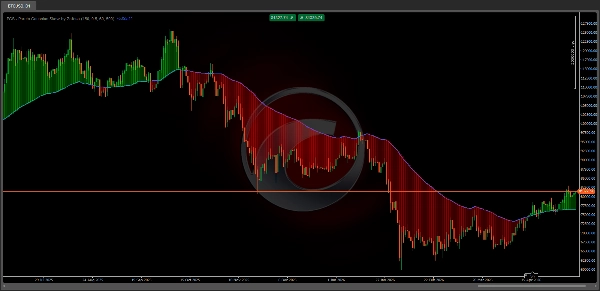
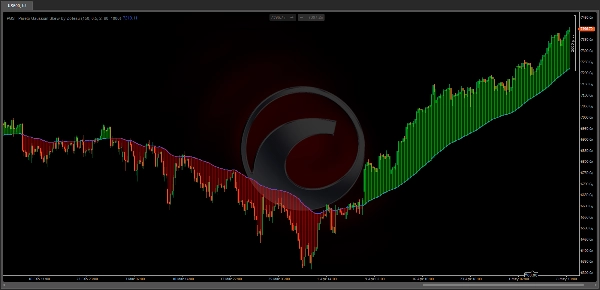
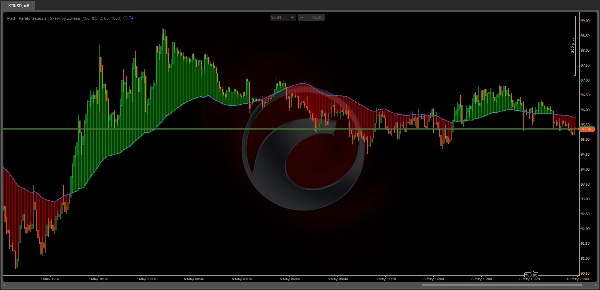
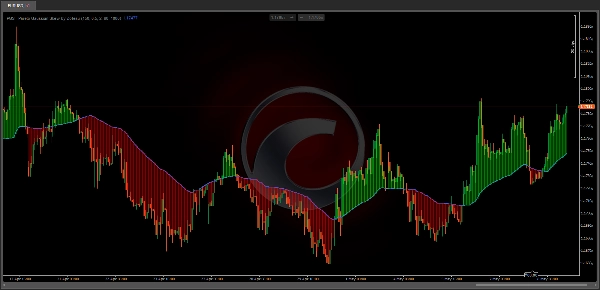
📊 PGS — Pareto-Gaussian Skew by Zofesu — Institutional Gravity Line & Tension Cloud. PGS is a precision overlay indicator built on two mathematical principles: the Gaussian distribution and the Pareto 80/20 rule. It identifies the invisible gravitational center of price — filtering out noise and focusing only on the 20% of moves that drive 80% of the trend.

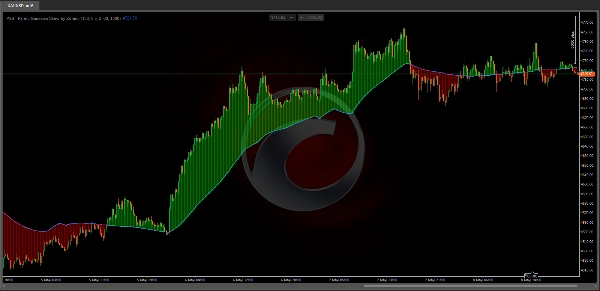
⚙ HOW IT WORKS The indicator calculates a dynamic baseline (SMA) and standard deviation over a configurable lookback window. Only price moves that exceed one standard deviation are considered statistically significant — these represent institutional displacement, not random noise. The Pareto Skew Factor amplifies these extreme moves and feeds them into an EMA smoother, producing a stable gravity line that adapts to market structure. The Tension Cloud fills the space between price and the gravity line: Green cloud (price > PGS line) — price is above gravity, bullish bias Red cloud (price < PGS line) — price is below gravity, bearish bias The wider the cloud, the more extended price is from its statistical center — a potential reversion zone.

🔑 KEY FEATURES
✅ Pareto-Gaussian gravity line — filters noise, reacts only to institutional moves
✅ Dynamic Tension Cloud — visualizes distance between price and gravity center
✅ Configurable Skew Factor — control sensitivity to extreme price displacement
✅ Adjustable lookback (Smith's Memory) — 20 to 500 bars
✅ Custom cloud colors and opacity — full visual control
✅ Max Cloud Bars limit — performance-optimized rendering
✅ Lightweight C# — no performance impact

📚 HOW TO USE

  1. Add PGS to any chart and timeframe
  2. Watch the PGS blue line — this is your gravity center
  3. Green cloud = price above gravity → look for long setups or trend continuation
  4. Red cloud = price below gravity → look for short setups or trend continuation
  5. Wide cloud = price is extended → potential mean reversion zone, reduce position size or wait
  6. Price crossing the PGS line = gravity shift → potential trend change
  7. Use in confluence with S/R levels, VWAP, or volume signals

Works on any TimeFrame and Asset: Indices (NAS100, SPX500), Forex, Gold, Crypto

🔗 PARAMETERS

  • Smith's Memory (Lookback) — statistical window for SMA and StdDev calculation (default 150, range 20–500)
  • Pareto Skew Factor — weight of extreme moves in gravity calculation (default 0.5, range 0.1–1.0)
  • PGS line thickness can be adjusted via right-click → Format on the indicator or Properties → lines (default 2)
  • Cloud Opacity (0–200) — transparency of the Tension Cloud (default 60, 0=Off)
  • Max Cloud Bars — maximum number of bars rendered for the cloud (default 500)
  • Bull Cloud Color — color when price is above gravity (default green)
  • Bear Cloud Color — color when price is below gravity (default red)

📝 NOTES

  • Higher Skew Factor (0.8–1.0) = gravity line reacts more aggressively to institutional moves
  • Lower Skew Factor (0.1–0.3) = smoother, more conservative gravity line
  • Higher Lookback = slower, macro-level gravity center
  • Lower Lookback = faster, more reactive to recent price action
  • Max Cloud Bars upper limit is 2000. Values above 1000 may impact performance. On lower timeframes (M5 and below) use 300 or less.

⚠️ DISCLAIMER Trading financial instruments involves substantial risk of loss. Past performance of any indicator or strategy does not guarantee future results. This tool is provided for informational and educational purposes only. Always use proper risk management and never risk more than you can afford to lose. The author is not responsible for any trading losses incurred through the use of this indicator.

Resumo

Perfil do indicador
Categoria do indicador
Estrutura do mercado (SMC)
Tipo de resultado
Visualização
Requisitos de dados
Apenas barras
Sinais suportados
Força da tendência
Toque no nível
Quebra de nível
Inversão

Conversa

Avaliações de clientes

0.0
Avaliações: 0
Avaliações de clientes
Ainda não há avaliações para este produto. Já o experimentou? Seja o primeiro a contar a outras pessoas!

Perguntas frequentes

EMA
Supertrend
Key Levels
MSS
Volume
Market Structure
VWAP
Os produtos disponíveis através da cTrader Store, incluindo bots de negociação, indicadores e plugins, são fornecidos por programadores terceiros e são disponibilizados apenas para fins informativos e de acesso técnico. A cTrader Store não é um corretor e não fornece aconselhamento em matéria de investimento, recomendações pessoais ou qualquer garantia de desempenho no futuro.

Mais deste autor

Indicador
VWAP
Forex
+7
VWAP + Swing Liquidity + SFP Signals — detects liquidity sweeps with color-coded alerts.
Indicador
SMC
Forex
+5
Fear & Greed engine — detects institutional overheating with BB + Percentile signals.

Também poderá gostar de

Indicador
BOS
EMA
+5
VWAP Bands indicator with 3 standard deviation levels, buy/sell zones, and a draggable ON/OFF button to toggle the entir
Indicador
ATR
BOS
+5
Market structure with BOS and CHoCH, order blocks, and retest buy/sell arrows with entry, stop and two targets
Indicador
Key Levels
Trend-filtered signals, transparent trade plans and a multi-timeframe decision panel for cTrader.
Indicador
Smoothed CCI alerts! Audio & arrow signals for +/-100 crosses. Custom sounds & arrow filters. Precision trading!
Logótipo de "UT Bot"
Popular
4.4
(5)
$19
/
$20
Indicador
ATR
Forex
+11
Trend-following indicator with dynamic ATR-based trailing stop for precise entry/exit signals
Indicador
Volume
Key Levels
View tick activity across a selected chart range with Point of Control, Value Area High and Value Area Low.
Indicador
Grid
Prop
+16
Those who are involved in trading know how important it is to take into account the previous session. With Order Block
Logótipo de "FBX VWAP"
Bem avaliado
4.5
(4)
$19
Indicador
Prop
VWAP
+12
FBX VWAP Anchored — Professional VWAP
Indicador
Forex
EURUSD
+1
Designed to follow price more naturally, adjusting automatically to market speed, to reduce lag and false signals.
Indicador
VWAP
Support & Resistance
Trading.FC$_vwap Algo shows VWAP trends, dynamic support/resistance and deviation bands to spot potential trade entries.
Indicador
Flexible VWAP indicator with multiple reset periods (daily, weekly, custom,...) and timezone support for session trading
Indicador
SMC
Forex
+13
MultiFrameCandles para cTrader: La Herramienta Definitiva para Dominar Cualquier Marco de Tiempo
Indicador
EMA
Supertrend
+4
Dynamic dual MA cloud indicator. Identifies trends, crossovers, and pullback entries in real time for any asset.
Indicador
Prop
Forex
+12
Identify and trade breakouts with Consolidation Zones! Visualize price consolidation areas for trading opportunities.
Indicador
ATR
RSI
+14
A metric that can set 1 to 3 groups of Bollinger Bands
Indicador
ADX
Breaker Block
+1
I share with you the Elliott Wave Oscillator. Hernan Nievas, Rosario, Argentina. April 28, 2026.
Indicador
Forex
Identify 34 candlestick patterns, track trends across timeframes, and get instant alerts with this powerful trading tool

Preço

Desde 01/12/2025
280
Instalações gratuitas