Deskripsi
Memperkenalkan Indikator "Grafik Harian": Kompas Anda untuk Keputusan Trading yang Tepat dan Efisien!
Bayangkan memiliki alat di tangan Anda yang tidak hanya menyederhanakan analisis pasar, tetapi juga meningkatkan kepercayaan dan ketepatan Anda dalam setiap operasi. Grafik Harian jauh lebih dari sekadar indikator biasa — ini adalah kunci untuk membuka wawasan kuat dan strategi pemenang dalam trading harian.
Mengapa Grafik Harian Sangat Penting untuk Kesuksesan Anda?
- Ketepatan Tak Tertandingi:
-
- Grafik Harian mengidentifikasi titik masuk dan keluar dengan ketepatan tinggi. Setiap sinyal dihitung berdasarkan data yang kuat dan dapat dipercaya, menghilangkan dugaan dan meningkatkan tingkat keberhasilan Anda.
- Visualisasi Jelas dan Intuitif:
-
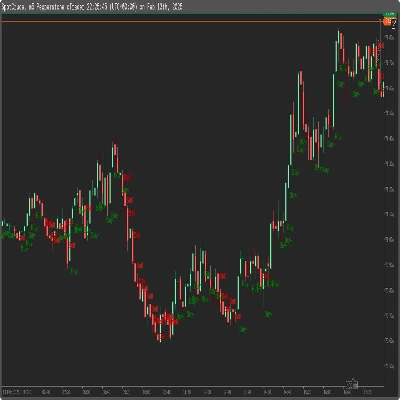
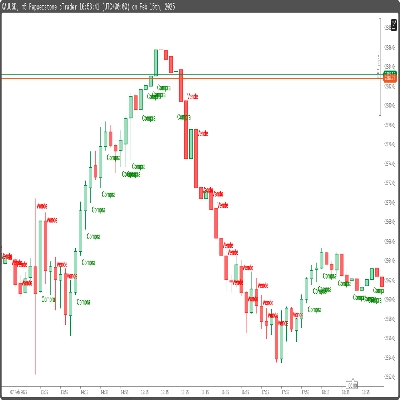
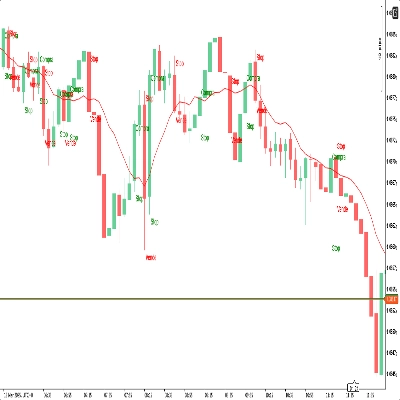
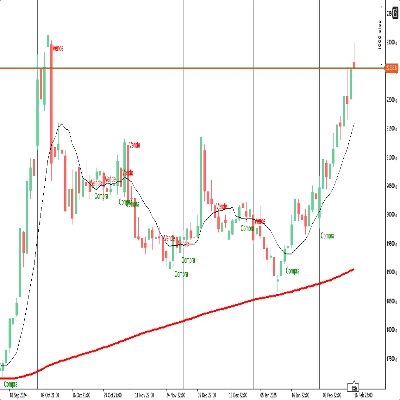
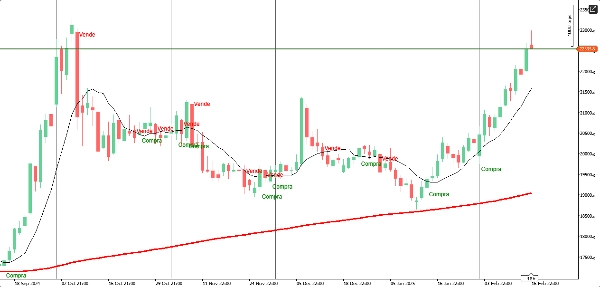
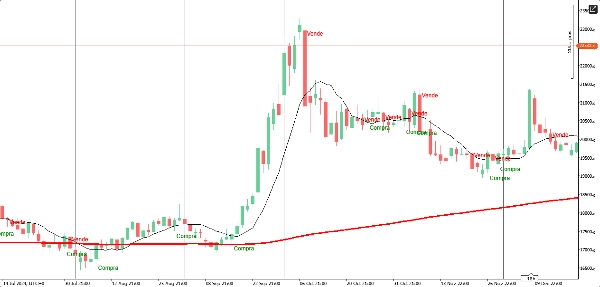
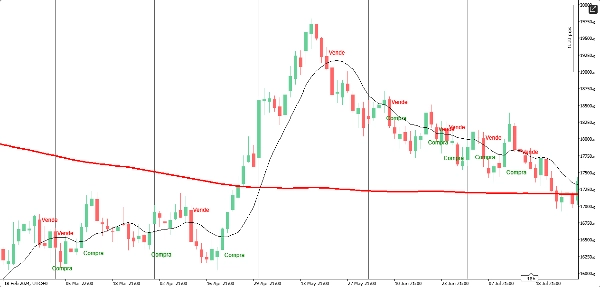
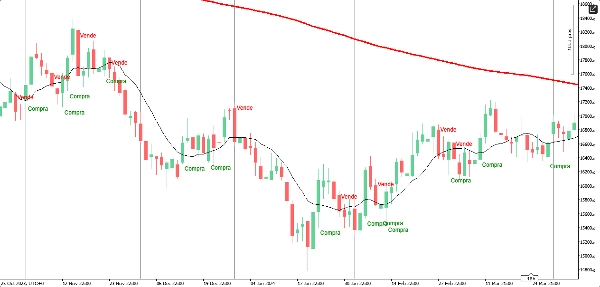
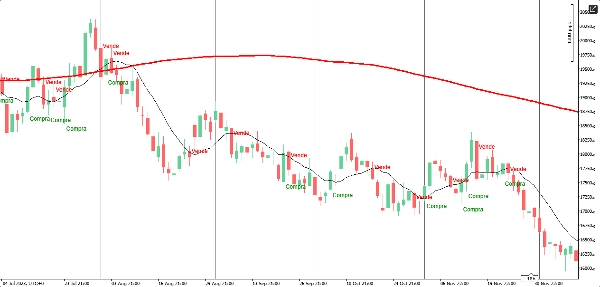
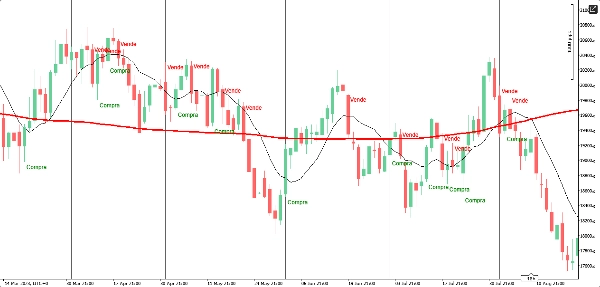
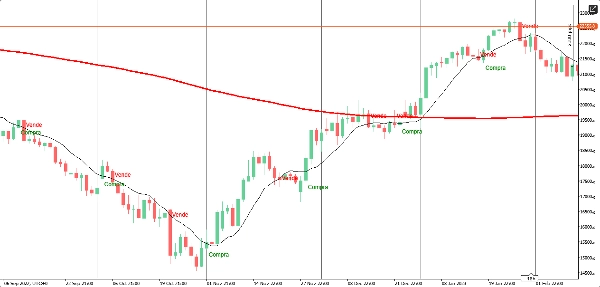
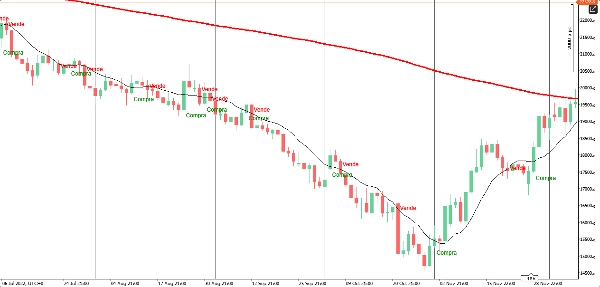
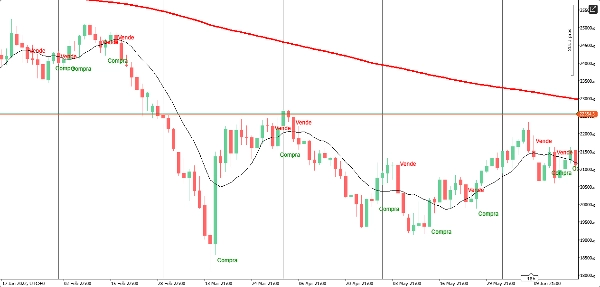
- Dengan teks yang dipusatkan dan ditempatkan secara strategis di atas atau di bawah candle, Grafik Harian menawarkan pengalaman visual yang sempurna. Anda tidak akan membuang waktu lagi menganalisis grafik yang membingungkan — sinyal "Beli" dan "Jual" ditonjolkan dengan jelas dan langsung, memungkinkan keputusan yang cepat dan efektif.
- Adaptasi untuk Setiap Strategi:
-
- Apakah Anda trader konservatif atau agresif, Grafik Harian menyesuaikan dengan gaya Anda dengan sempurna. Ini berfungsi sebagai pelengkap penting untuk setiap strategi, mulai dari scalping hingga operasi swing trading.
- Hemat Waktu dan Tenaga:
-
- Ucapkan selamat tinggal pada jam-jam yang dihabiskan untuk menganalisis grafik secara manual. Grafik Harian mengotomatisasi identifikasi peluang, memungkinkan Anda fokus pada hal yang benar-benar penting: menjalankan operasi Anda dengan percaya diri.
- Desain Profesional dan Dapat Disesuaikan:
-
- Dengan warna yang cerah dan tata letak yang bersih, Grafik Harian tidak hanya meningkatkan analisis Anda, tetapi juga meningkatkan estetika grafik Anda. Sesuaikan warna dan gaya agar menyatu sempurna dengan lingkungan trading Anda.
Apa yang Anda Dapatkan dengan Grafik Harian?
- Sinyal Terpercaya: Identifikasi tren dan pembalikan dengan ketepatan bedah.
- Pengambilan Keputusan Cepat: Tindakan yang jelas dan langsung, tanpa ragu.
- Pengurangan Kebisingan: Fokus hanya pada yang penting, tanpa gangguan.
- Fleksibilitas: Gunakan pada aset apa pun dan timeframe apa pun.
Untuk Siapa Grafik Harian?
- Pemula: Permudah perjalanan trading Anda dengan alat yang membimbing keputusan Anda.
- Trader Berpengalaman: Tingkatkan strategi Anda dengan wawasan tambahan dan konfirmasi yang tepat.
- Investor Jangka Panjang: Identifikasi titik masuk ideal untuk memaksimalkan pengembalian Anda.
Ubah Analisis Teknikal Anda Hari Ini Juga!
Grafik Harian bukan hanya indikator — ini adalah sekutu strategis yang menempatkan Anda di depan kompetisi. Dengan ini, Anda akan memiliki kejelasan dan kepercayaan yang diperlukan untuk membuat keputusan yang mendorong hasil Anda.
Jangan buang waktu! Dapatkan sekarang Grafik Harian dan mulai trading dengan ketepatan seorang profesional.
Grafik Harian: Alat yang Dibutuhkan Setiap Trader, tapi Hanya Sedikit yang Memilikinya.
Jadilah salah satu yang pertama merasakan revolusi dalam trading ini. Kesuksesan Anda dimulai di sini! 🚀
Ringkasan
This tool adapts to various trading styles, from conservative to aggressive, and supports strategies ranging from scalping to swing trading. It automates opportunity identification, saving time and effort by minimizing manual chart analysis. The design features a professional, customizable layout with vibrant colors and a clean interface that integrates seamlessly into different trading environments.
Key benefits include reliable signals for trend and reversal detection, rapid decision-making support, noise reduction to focus on relevant data, and versatility across assets and timeframes. The Gráfico Diário suits beginners seeking guided analysis, experienced traders aiming to refine strategies, and long-term investors looking for optimal entry points. It serves as a strategic ally to improve technical analysis clarity and confidence in executing trades.
Ulasan pelanggan
5 | 100 % | |
4 | 0 % | |
3 | 0 % | |
2 | 0 % | |
1 | 0 % |