

Opis
Session Trade Journal Pro turns your cTrader closed-deal history into a clear monthly review inside a desktop custom frame. It helps you see when, where and how your results were produced. The plugin is read-only: it does not place, change or close orders.
Explore your history:
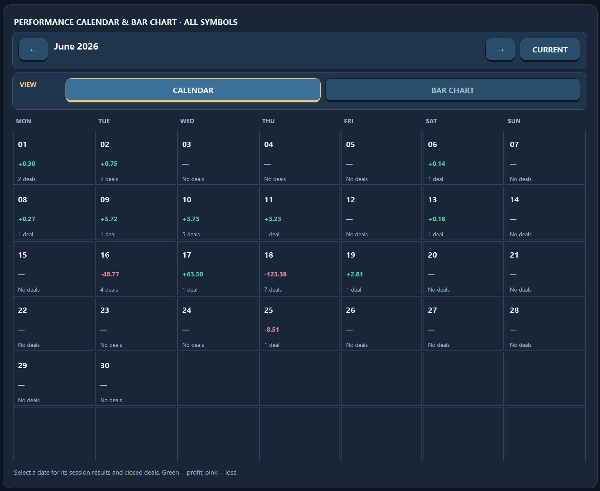
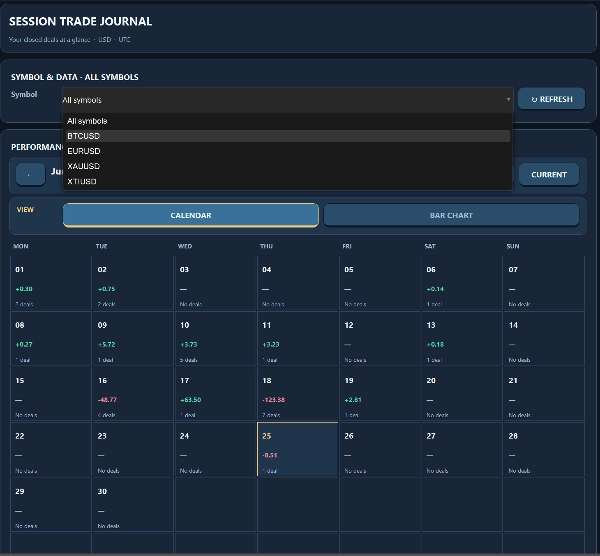
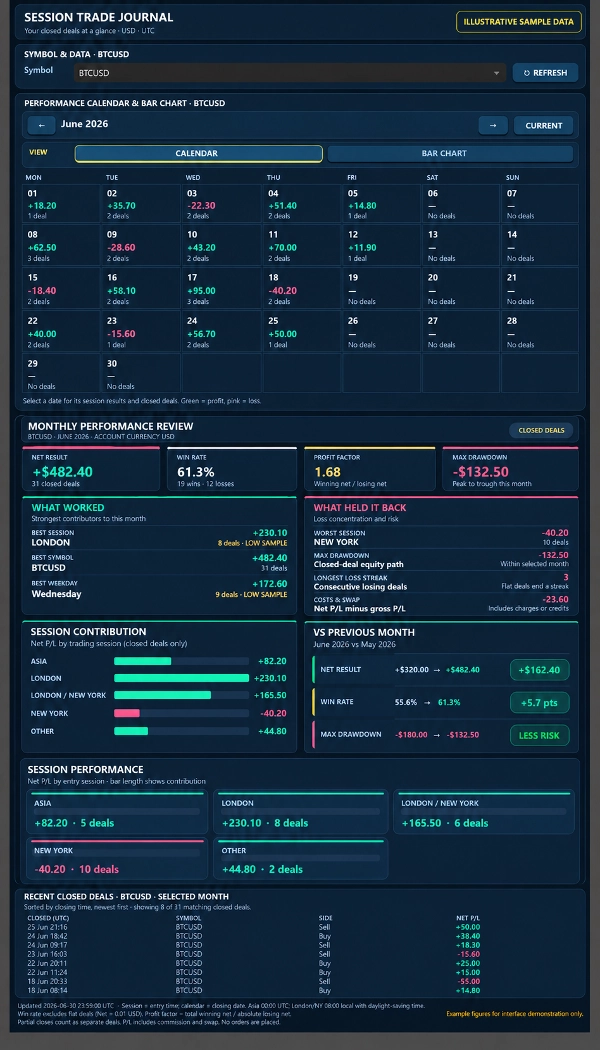
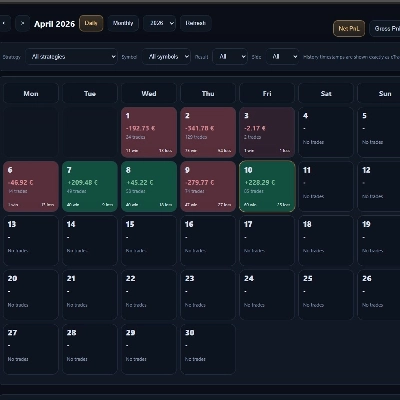
• Use the monthly calendar to see each day's net P/L and number of closed deals. Select a date to focus the session breakdown and recent-deal list on that day.
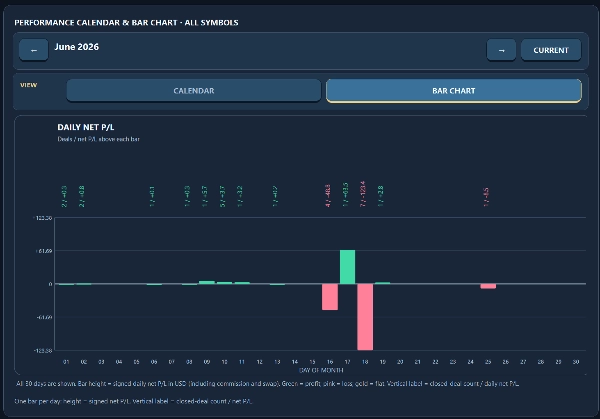
• Switch to the bar chart to compare signed net P/L across every day of the selected month. Each active day shows its deal count and net P/L.
• Filter to one symbol or review all symbols. Move between months, return to the current month, and press Refresh to reload closed-deal history.
Understand the month:
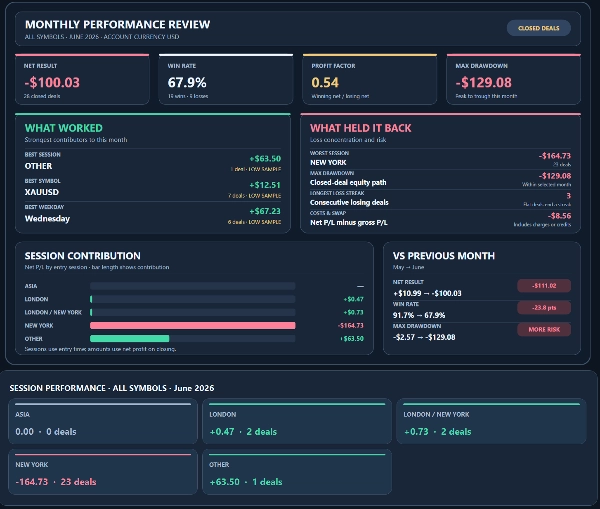
• The Monthly Performance Review shows net result, win rate, profit factor and maximum closed-deal drawdown.
• Find the strongest session, symbol and weekday; see the weakest session, longest losing-deal streak, and the combined effect of costs and swap.
• Compare session contributions and key metrics with the previous month. Segments with fewer than 10 deals are marked LOW SAMPLE.
• Review up to eight matching closed deals, sorted by closing time.
How the figures are calculated:
Calendar dates and monthly totals use UTC closing dates. Session analysis uses trade entry times. London and New York follow local session hours with daylight-saving time, and their overlap has a separate category. Net P/L includes commission and swap. The costs and swap figure is net P/L minus gross P/L. Monthly drawdown measures the largest peak-to-trough decline in cumulative closed-deal net P/L for the selected month and symbol; it does not include open positions or intratrade drawdown. Partial closes appear as separate deals.
Designed for traders who want to review historical performance by date, instrument and trading session. It uses the closed-deal history available in the connected cTrader account. No specific chart symbol or timeframe is required. Refresh is manual. This journal provides analysis, not trade signals or automated execution.
Trading involves risk. Past performance does not guarantee future results.
Podsumowanie
The Monthly Performance Review summarizes key metrics including net result, win rate, profit factor, and maximum closed-deal drawdown. It identifies strongest and weakest trading sessions, symbols, and weekdays, tracks longest losing streaks, and accounts for costs and swap effects. Comparisons with the previous month’s performance are available, with segments of fewer than 10 deals marked as low sample.
Calculations use UTC closing dates for calendar views and trade entry times for session analysis, covering London and New York sessions plus their overlap. Net P/L includes commissions and swaps; drawdown measures peak-to-trough declines in closed-deal net P/L within the month. Partial closes are treated as separate deals. This tool is designed for traders seeking historical performance insights by date, instrument, and session without automated trading or signal generation.
Dyskusja
Opinie klientów
Częste pytania
Więcej od tego autora





Cena