Penerangan
⚠️ Kami telah berpindah ke 👉 PrimeQuant
🚫🚫🚫 Jangan beli penunjuk ini!
Penunjuk OHLC PRO oleh LudwigICT adalah alat lapisan carta pelbagai ciri yang direka untuk memberikan visualisasi profesional dan kaya maklumat pada carta cTrader anda.
Berikut adalah pecahan apa yang dilakukannya:
🔹 Fungsi Teras: Lapisan OHLC
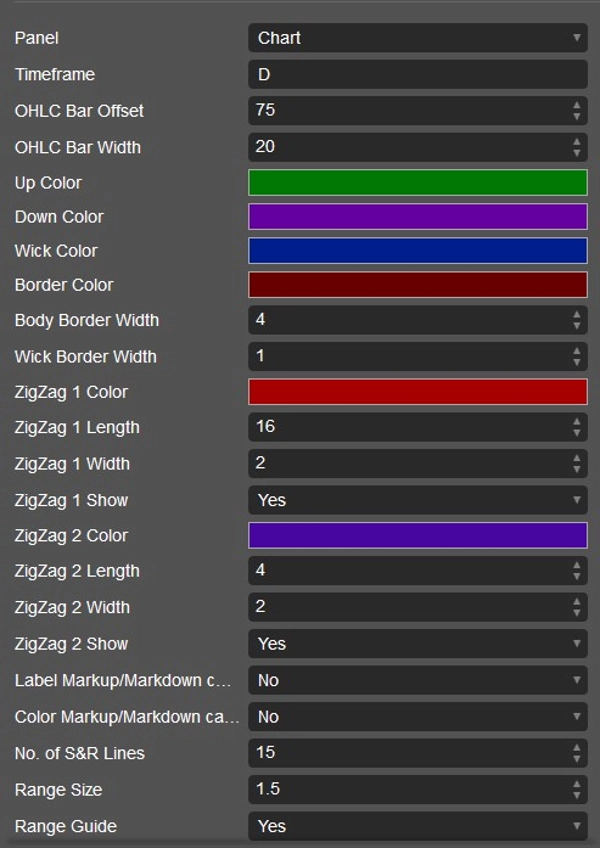
- Melukis bar OHLC (Buka, Tinggi, Rendah, Tutup) tersuai pada carta anda.
- Anda boleh menetapkan:
-
- OHLC jangka masa mana yang digunakan (Harian, Mingguan, Bulanan, atau intrahari seperti H1, M15, dll.).
- Offset bar (jarak dari lilin semasa).
- Lebar bar, sumbu, sempadan, dan warna tersuai.
- Secara berkesan, anda mendapat “lilin rujukan” dari jangka masa yang lebih tinggi diletakkan pada carta semasa anda.
🔹 Tetapan Triple-M (Isyarat Bullish/Bearish)
- Mengesan corak rendah berturut-turut yang lebih tinggi (bullish) atau tinggi lebih rendah (bearish).
- Apabila dikesan:
-
- Boleh meletakkan ikon segitiga (atas atau bawah) pada lilin.
- Boleh juga menukar warna bar untuk menunjukkan peralihan momentum.
- Ini bertindak seperti isyarat peralihan struktur momentum.
🔹 Alat ZigZag Berganda
- Dua lapisan ZigZag bebas:
-
- ZigZag #1 (panjang lebih lama, contohnya struktur ayunan).
- ZigZag #2 (panjang lebih pendek, contohnya ayunan mikro).
- Menonjolkan ayunan pasaran untuk analisis struktur, tren, dan pecahan.
🔹 Sokongan & Rintangan Gann
- Menggunakan jadual nombor Gann + logik ATR untuk mengira tahap S/R.
- Melukis pelbagai garis sokongan/rintangan di atas dan di bawah harga.
- Garis boleh bergaya (pejal, bertitik, dilanjutkan ke kiri, dll.).
- Label tahap dengan nilai harga.
- Juga memberikan Panduan Julat:
-
- “Julat Sebelumnya” vs. “Julat Seterusnya” berbanding ATR.
- Membantu meramalkan zon pengembangan atau pengecutan.
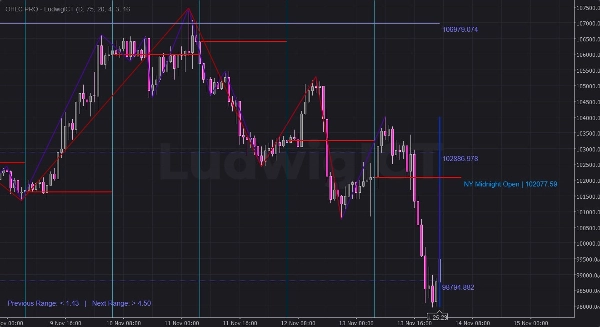
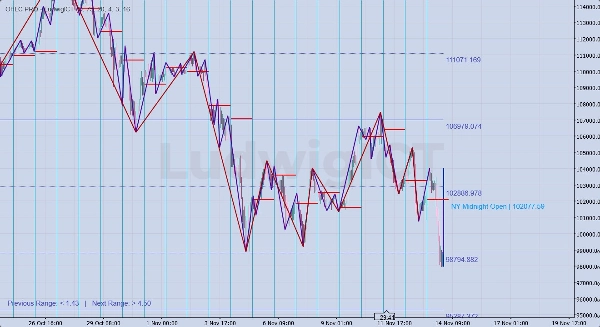
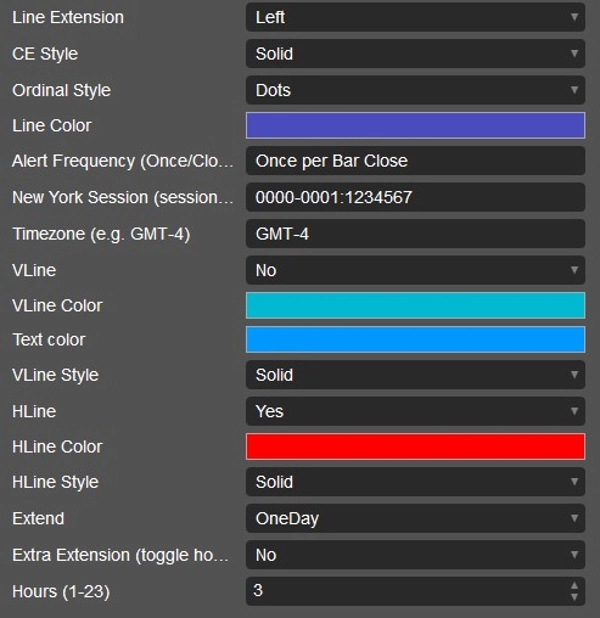
🔹 Tahap Tengah Malam New York
- Secara automatik mengesan harga buka tengah malam sesi New York.
- Melukis:
-
- Garis mendatar pada harga buka tengah malam NY.
- Garis menegak pada permulaan sesi.
- Label menunjukkan “NY Midnight Open | harga”.
- Anda boleh melanjutkan garis ini selama 1 atau 2 hari, atau menambah jam tambahan.
- Berguna untuk perdagangan gaya ICT (bias sesi New York, titik keseimbangan, dll.).
🔹 Penyesuaian & Amaran
- Setiap ciri mempunyai parameter dalam dropdown:
-
- Warna, gaya, lanjutan garis, bilangan garis, dll.
- Amaran disokong (walaupun terutamanya melalui visual carta—parameter kekerapan amaran ada).
- Penghapusan bersih apabila penunjuk ditutup (supaya carta anda tidak kekal sesak).
✅ Ringkasnya:
Penunjuk ini adalah alat tindakan harga serbaguna. Ia menggabungkan:
- Lilin OHLC jangka masa lebih tinggi
- Isyarat corak momentum (Triple-M)
- Dua struktur ZigZag
- Tahap S/R Gann + panduan julat
- Penanda buka tengah malam sesi New York
Ia dibuat untuk perdagangan berasaskan struktur, sesi, dan tahap, sangat berguna untuk pedagang gaya ICT atau tindakan harga.
Saya terangkan bagaimana anda boleh menggunakannya secara praktikal semasa berdagang XAU/USD
🔹 Penggunaan Perdagangan Praktikal (Emas dengan OHLC PRO)
1. Lapisan OHLC Jangka Masa Lebih Tinggi
- Contoh: Lukis OHLC Harian semasa berdagang pada M5/M15.
- Anda akan melihat lilin semalam “di dalam” carta intrahari anda.
- Penggunaan:
-
- Harga menghampiri tinggi/rendah hari sebelumnya = kawasan pemburuan kecairan.
- Buka/tutup harian = penapis bias (atas = bullish, bawah = bearish).
- Membantu anda berdagang dalam julat harian.
👉 Pada emas, sesi NY sering menyerang tinggi/rendah hari sebelumnya sebelum berbalik.
2. Isyarat Triple-M
- Corak Triple-M (rangkaian rendah yang meningkat atau tinggi yang menurun) = momentum jangka pendek.
- Penggunaan:
-
- Triple-M bullish berhampiran sokongan (rendah HTF atau buka tengah malam NY) → kemungkinan scalp panjang.
- Triple-M bearish berhampiran rintangan (tinggi HTF atau tahap Gann) → kemungkinan scalp pendek.
- Boleh mewarnakan bar untuk pengenalan visual pantas dalam pergerakan emas yang cepat.
👉 Berfungsi dengan baik untuk kemasukan sniper pada M1–M5 apabila selari dengan bias HTF.
3. ZigZag Berganda
- ZigZag #1 (panjang lebih lama) = struktur ayunan.
- ZigZag #2 (panjang lebih pendek) = struktur mikro.
- Penggunaan:
-
- Kenal pasti pecahan struktur pasaran (BOS/CHOCH).
- Berdagang hanya mengikut arah ZigZag yang lebih besar (#1).
- Gunakan ZigZag yang lebih kecil (#2) untuk pengesahan kemasukan.
👉 Contoh: Bias harian bullish → tunggu peralihan ZigZag #2 bullish berhampiran sokongan HTF.
4. Sokongan & Rintangan Gann
- Menghasilkan grid tahap S/R matematik.
- Penggunaan:
-
- Jika harga sedang mengukuh, tahap menandakan kemungkinan titik pecahan pengembangan.
- Gabungkan dengan panduan julat ATR:
-
- "Julat Sebelumnya" kecil → jangkaan pengembangan volatiliti.
- "Julat Seterusnya" tinggi → tahap pecahan kuat di hadapan.
👉 Pada emas, tahap Gann sering sejajar dengan nombor bulat (contoh 2400, 2420, 2435).
5. Buka Tengah Malam New York
- Ini adalah salah satu alat ICT paling berkuasa untuk emas.
- Penggunaan:
-
- Harga berbanding buka tengah malam NY = bias arah.
- Jika harga kekal di atas buka tengah malam → sesi NY bullish.
- Jika di bawah → bias bearish.
- Garis mendatar bertindak sebagai rujukan keseimbangan (50%).
- Perhatikan sapuan kecairan sekitar tahap ini dalam zon pembunuh London/NY.
👉 Contoh:
Buka tengah malam NY = 2405.
- Jika London menurunkan harga ke 2398 dan NY merebut kembali 2405 → setup panjang kuat.
🔑 Menggabungkan Semua (Contoh Tetapan)
- Mulakan sesi NY:
-
- Lukis OHLC Harian.
- Catat buka tengah malam NY.
- Perhatikan tahap Gann berdekatan.
- Tunggu sergapan kecairan (serangan Tinggi/Rendah Harian atau SR Gann).
- Periksa Triple-M / ZigZag #2 untuk pengesahan bullish/bearish mikro.
- Masuk dengan stop di belakang sapuan kecairan.
- Sasaran sisi bertentangan julat atau tahap Gann/HTF seterusnya.
✅ Ringkasnya:
- OHLC Harian + Tengah Malam NY = penapis bias.
- ZigZag + Triple-M = masa kemasukan.
- Gann + Panduan Julat = sasaran keuntungan & isyarat pengembangan.
Penunjuk ini pada dasarnya memberi anda semua alat gaya ICT dalam satu pakej untuk XAU/USD.
Jika anda mempunyai sebarang soalan atau menghadapi sebarang masalah, jangan ragu untuk menghubungi saya. Saya gembira untuk membantu anda!
Penafian:
Dengan menggunakan algoritma saya, anda mengakui bahawa perdagangan melibatkan risiko yang melekat dan prestasi lalu tidak menjamin keputusan masa depan. Adalah penting bahawa anda mempunyai strategi pengurusan risiko yang kukuh dan, yang paling utama, anda kekal berdisiplin dalam mematuhi tahap stop-loss. Kegagalan mengurus risiko dengan betul boleh menyebabkan kerugian yang besar. Saya tidak bertanggungjawab atas sebarang hasil kewangan yang timbul daripada penggunaan algoritma ini. Berdagang dengan bertanggungjawab dan sentiasa ikut amalan pengurusan risiko yang betul.
Semoga berjaya! 🙌
Ringkasan
Ulasan pelanggan
5 | 100 % | |
4 | 0 % | |
3 | 0 % | |
2 | 0 % | |
1 | 0 % |


