Penerangan
Apa itu dan untuk apa ia
WHT AIRRA (Adaptive Intelligent Risk/Reward Algorithm) adalah penunjuk profesional yang secara automatik mengira tahap stop-loss dan take-profit berdasarkan volatiliti pasaran sebenar. Ini algoritma adaptif dan pintar menapis dengan cepat pelbagai rejim pasaran (tren, julat, volatiliti tinggi/rendah), sentiasa menyesuaikan dengan keadaan semasa. Ia menghapuskan ketidakpastian menggunakan nombor sewenang-wenangnya, membolehkan pengurusan risiko yang koheren dan profesional.
Apa yang BUKAN
Ia TIDAK menjana isyarat beli/jual automatik dan bukan sistem perdagangan lengkap. Ia bukan alat ramalan untuk pergerakan masa depan. Ia eksklusif sebagai penyelesaian pengurusan risiko yang menjawab "di mana untuk keluar jika salah?", bukan "di mana untuk masuk?".
Ciri utama
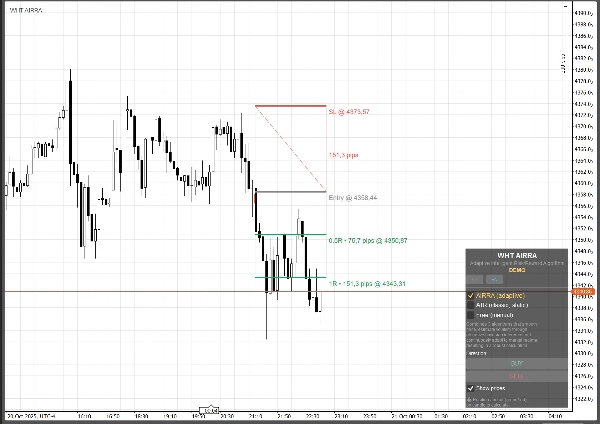
Menawarkan tiga mod operasi: AIRRA (adaptif pintar dengan pengenalan rejim), ATR (kaedah klasik tradisional), dan Free (kawalan manual). Termasuk visualisasi profesional dengan zon berwarna, label dengan harga tepat dalam pips, dan nisbah R:R automatik (0.5R, 1.0R). Antara muka dwibahasa ES/EN dengan penukaran segera. Versi DEMO terhad kepada 1 contoh tunggal dan 2 take-profit tetap.
Butiran teknikal
Melaksanakan seni bina pengiraan tiga lapisan: penapisan digital IIR rekursif order kedua untuk penghapusan bunyi frekuensi tinggi, anggaran volatiliti melalui inferens Bayesian rekursif dengan pengurusan ketidakpastian probabilistik, dan faktor skala kalibrasi sendiri menggunakan kuasa terkecil rekursif dengan faktor pelupusan eksponen membolehkan penyesuaian perubahan rejim. Kompleksiti algoritma O(1) dalam mod adaptif, O(N) dalam mod klasik. Pemprosesan masa nyata dengan kemas kini setiap lilin, pengurusan memori cekap melalui penggunaan semula objek grafik, sistem pengesahan koheren, dan pengesanan rejim pasaran automatik untuk pelarasan parameter dalaman dinamik.


![Logo "[Stellar Strategies] Linear Regression Candles 1.1"](https://cdn.ctrader.com/image/webp/8b9cff9f-2431-46d2-b0ec-c7f55f4a4a6d_27918)


