Descrição
Análise de Negócios
Compreenda a qualidade da sua vantagem comercial com um painel de análise compacto focado em expectativa, robustez e estrutura de desempenho.
Análise de Negócios é um plugin poderoso de análise criado para traders que querem mais do que apenas números de lucro e perda. Em vez de mostrar apenas o que seu comércio gerou, ele ajuda você a entender como seus resultados estão sendo produzidos e se sua vantagem parece forte, equilibrada e confiável.
O plugin foca na qualidade estatística do seu comércio destacando expectativa, estrutura de pagamento, concentração de lucro, força de recuperação, consistência e comportamento do tempo de retenção em um painel limpo construído diretamente dentro do cTrader.
Principais Recursos
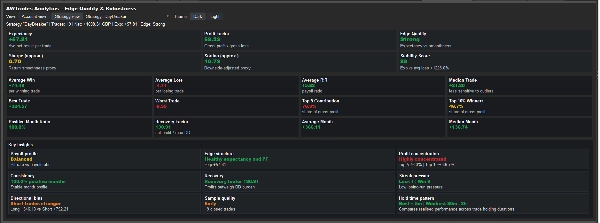
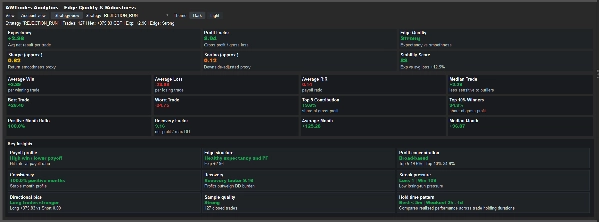
Painel de qualidade da vantagem
Avalie rapidamente a qualidade geral da sua abordagem comercial com métricas claras, incluindo:
• Expectativa
• Fator de Lucro
• Sharpe (aprox.)
• Sortino (aprox.)
• Pontuação de Estabilidade
• Avaliação da Qualidade da Vantagem
Isso oferece uma visão rápida se seus resultados comerciais parecem robustos, suaves ou frágeis.
Análise da estrutura de pagamento
Entenda como sua vantagem é construída revisando:
• Ganho médio
• Perda média
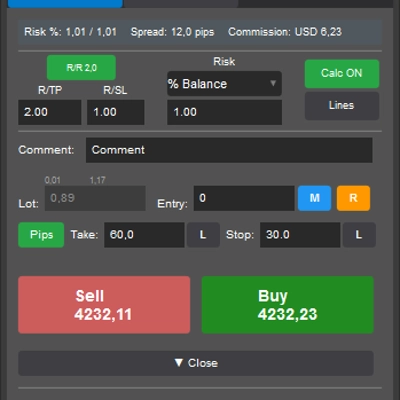
• Perfil médio de recompensa-risco
• Negociação mediana
• Melhor negociação
• Pior negociação
Isso ajuda a ver se sua estratégia depende mais da taxa de acerto, do pagamento ou de uma combinação de ambos.
Painel de insights chave
Análise de Negócios transforma estatísticas brutas em um conjunto mais legível de conclusões, destacando áreas como:
• Perfil de pagamento
• Estrutura da vantagem
• Concentração de lucro
• Consistência
• Força de recuperação
• Pressão de sequência
• Viés direcional
• Qualidade da amostra
• Padrão de tempo de retenção
Isso torna o painel mais fácil de interpretar rapidamente.
Concentração de lucro e robustez
Veja se seus resultados estão amplamente distribuídos ou fortemente dependentes de um pequeno número de negociações.
Inclui:
• Contribuição dos 5 principais
• Contribuição dos 10% principais vencedores
• Fator de recuperação
• Proporção de meses positivos
• Pontuação de estabilidade
Isso ajuda a identificar se o desempenho parece sustentável ou excessivamente dependente de valores atípicos.
Insight do padrão de tempo de retenção
Análise de Negócios compara o desempenho realizado em diferentes durações de retenção de negociações para mostrar onde sua vantagem foi mais forte ou mais fraca.
Isso não assume que retenções mais curtas ou mais longas são inerentemente melhores. Em vez disso, mostra o que realmente funcionou melhor na amostra selecionada.
Visualizações de conta e estratégia
Analise todo o histórico da sua conta ou concentre-se apenas em estratégias rotuladas.
Use:
• Visualização da conta
• Visualização da estratégia
• Seletor de estratégia
• Temas escuro e claro
Isso facilita revisar tanto o desempenho geral quanto os sistemas individuais.
Criado para traders que querem uma visão mais profunda do desempenho
Análise de Negócios é ideal para traders que querem entender não apenas o que aconteceu, mas quão forte e confiável sua vantagem comercial realmente é.
É útil para:
• Traders manuais revisando a qualidade de sua execução
• Traders de sistema analisando a força de uma estratégia
• Provedores de sinais avaliando robustez e consistência
• Traders comparando diferentes estratégias rotuladas dentro de uma conta
Combina perfeitamente com outras ferramentas AWTrades:
Análise de Negócios foi projetada para complementar o conjunto mais amplo de ferramentas AWTrades:
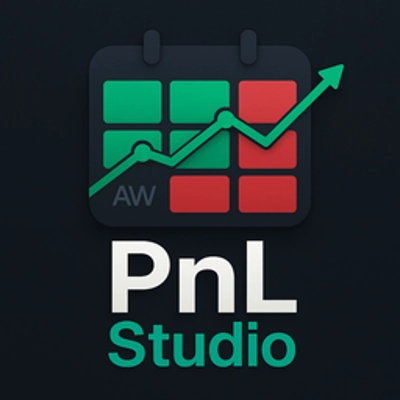
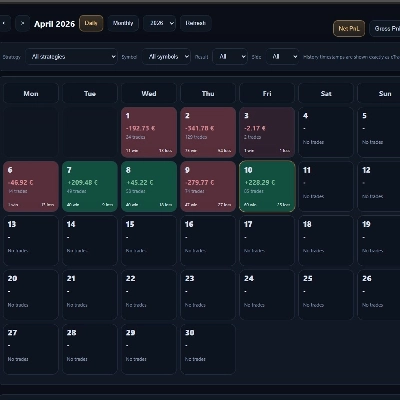
• PnL Studio – para revisão visual de desempenho, detalhamento diário e análise baseada em calendário
• Risk Watch – para monitoramento ao vivo de exposição, risco aberto e risco no pior cenário
Juntos, os três plugins fornecem um fluxo de trabalho de negociação mais completo:
- PnL Studio = revisão visual de desempenho
- Risk Watch = monitoramento de risco ao vivo
- Análise de Negócios = análise da qualidade da vantagem e robustez
Limpo, leve e fácil de usar
O plugin roda diretamente dentro do cTrader e não requer software externo.
Basta abrir a aba Análise de Negócios para revisar instantaneamente a qualidade estatística, estrutura e robustez do seu desempenho comercial.
Resumo
The plugin analyzes payoff structure by presenting average wins and losses, reward-to-risk profiles, median, best, and worst trades, helping users understand whether their strategy relies more on hit rate or payoff. A key insights panel translates raw data into readable conclusions covering payoff profile, edge structure, profit concentration, consistency, recovery strength, streak pressure, directional bias, sample quality, and holding time patterns.
Trade Analytics also evaluates profit concentration and robustness by showing contributions from top trades, recovery factors, positive month ratios, and stability scoring to identify performance sustainability. It compares realized performance across different trade holding durations without bias toward any specific timeframe.
Users can analyze either their full account history or individual labeled strategies, with options for account or strategy views and theme customization. The plugin complements other AWTrades tools like PnL Studio and Risk Watch, forming a comprehensive trading analysis workflow. It runs directly inside cTrader without requiring external software.