Opis
PnL Studio
Przekształć historię swoich transakcji w cTrader w wizualny pulpit wyników i natychmiast zobacz wzorce handlowe, mocne strony oraz obszary do poprawy.
PnL Studio to potężna wtyczka analityczna, która przekształca historię Twoich transakcji w czytelny wizualny pulpit. Zamiast przewijać długie listy transakcji, możesz szybko zrozumieć, jak Twoje handlowanie wypada na przestrzeni dni, tygodni i strategii.
Dzięki śledzeniu wyników na podstawie kalendarza, kluczowym statystykom oraz szczegółowym narzędziom do analizy transakcji, PnL Studio pomaga traderom analizować wyniki i identyfikować wzorce, które mogą poprawić podejmowanie decyzji.
Kluczowe funkcje
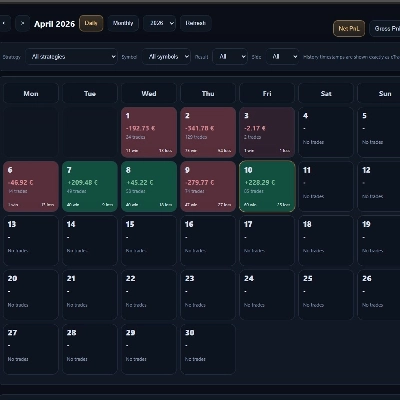
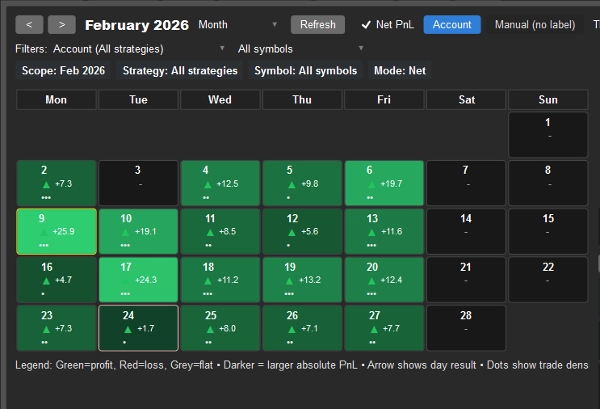
Wizualny kalendarz wyników handlowych
Natychmiast zobacz, jak wypadł każdy dzień handlowy dzięki kolorowemu kalendarzowi typu heatmap.
• Zielony = dni zyskowne
• Czerwony = dni stratne
• Ciemniejsze kolory = większy PnL
• Wskaźniki aktywności pokazują intensywność handlu
• Strzałki kierunkowe podkreślają dni zyskowne lub stratne
Kliknij dowolny dzień, aby zagłębić się w transakcje, które przyniosły ten wynik.
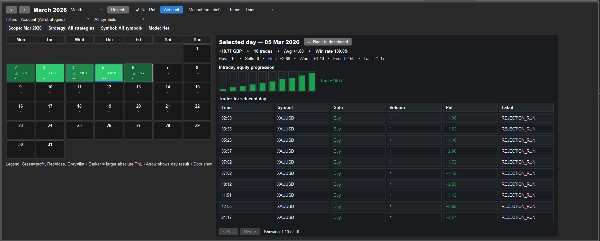
Przegląd transakcji dzień po dniu
Wybierz dowolny dzień z kalendarza, aby sprawdzić dokładne transakcje stojące za wynikiem.
Zobacz:
• Listę transakcji z symbolem, kierunkiem, wolumenem i PnL
• Etykietę strategii dla każdej transakcji
• Postęp kapitału w ciągu dnia
• Statystyki dnia, w tym najlepszą transakcję, najgorszą transakcję i wskaźnik wygranych
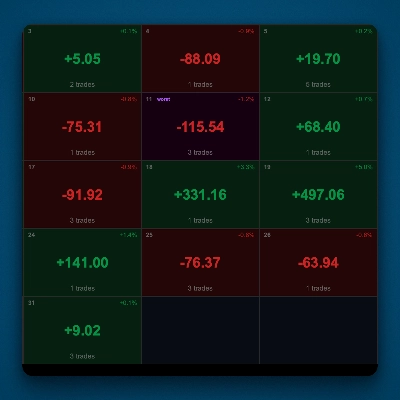
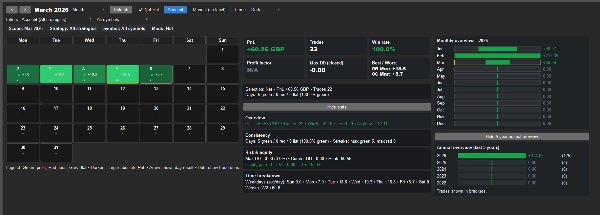
Miesięczny pulpit wyników
Szybko zrozum swoją miesięczną wydajność handlową dzięki kluczowym wskaźnikom, w tym:
• Całkowity PnL
• Liczba transakcji
• Wskaźnik wygranych
• Współczynnik zysku
• Maksymalny zamknięty drawdown
• Najlepsze i najgorsze dni handlowe
Filtrowanie strategii i symboli
Analizuj konkretne strategie lub rynki za pomocą elastycznych filtrów.
Filtruj wyniki według:
• Etykiety strategii
• Symbolu
• Brutto lub netto PnL
• Zakresu czasowego (miesiąc lub rok)
Przegląd wydajności strategii
Automatycznie podsumowuje wyniki dla każdej etykiety strategii, abyś mógł szybko porównać wydajność.
Zawiera:
• Całkowity zysk
• Średni wynik transakcji
• Liczba transakcji
• Ocena siły strategii
Długoterminowe wglądy w wydajność
Śledź spójność w czasie dzięki wbudowanym podsumowaniom, w tym:
• Miesięczny przegląd bieżącego roku
• Pięcioletni roczny podział wyników
Stworzony dla traderów, którzy chcą głębszych wglądów
Niezależnie od tego, czy handlujesz ręcznie, czy korzystasz z automatycznych strategii, PnL Studio pomaga zrozumieć, jak Twoje handlowanie wypada w czasie.
Użyj go, aby:
• Zidentyfikować zyskowne dni handlowe
• Wykryć wzorce wydajności
• Analizować zachowanie strategii
• Monitorować spójność handlu
Działa razem z innymi narzędziami AWTrades:
PnL Studio jest częścią szerszego zestawu narzędzi AWTrades zaprojektowanego, aby pomóc traderom lepiej rozumieć zarówno wyniki, jak i ryzyko.
Możesz go łączyć z:
• Risk Watch – wtyczka do monitorowania ryzyka na żywo, która pokazuje aktualną ekspozycję, ryzyko w najgorszym scenariuszu oraz koncentrację otwartych pozycji na Twoim koncie.
• Trade Analytics – zaawansowany pulpit oceniający statystyczną jakość Twojej przewagi handlowej, w tym oczekiwaną wartość, spójność i koncentrację zysków.
Razem te narzędzia tworzą pełniejszy workflow handlowy:
PnL Studio – wizualna analiza wyników
Risk Watch – monitorowanie ryzyka i ekspozycji na żywo
Trade Analytics – analiza jakości i odporności przewagi
Prosty i lekki
PnL Studio działa bezpośrednio w cTrader i nie wymaga żadnego zewnętrznego oprogramowania.
Po prostu otwórz kartę PnL Studio, aby natychmiast wizualizować i analizować swoje wyniki handlowe.
Podsumowanie
Opinie klientów
5 | 33 % | |
4 | 67 % | |
3 | 0 % | |
2 | 0 % | |
1 | 0 % |