Penerangan
Penunjuk yang bersih, ringkas, dan sangat visual yang mengesan persilangan antara dua Purata Pergerakan Mudah (SMA) dan memaparkan semuanya dengan jelas pada carta.
Ciri-ciri Utama:
- Anak panah berwarna besar tepat di titik persilangan → Hijau Limau ↑ → Persilangan menaik (potensi beli) → Merah ↓ → Persilangan menurun (potensi jual)
- Panel status kekal di sudut kanan atas carta → Jenis persilangan terkini (MENAIK / MENURUN / MENUNGGU) → Tarikh dan masa tepat persilangan → Tempoh purata bergerak yang dikonfigurasikan
- 100% tidak dicat semula
- Mengelakkan isyarat berganda pada bar yang sama
- Mencetak mesej ke log setiap kali persilangan berlaku (bagus untuk penjejakan)
- Sangat ringan – berfungsi dengan sempurna pada mana-mana jangka masa
Cara kegemaran saya untuk menggunakannya (dan yang saya cadangkan):
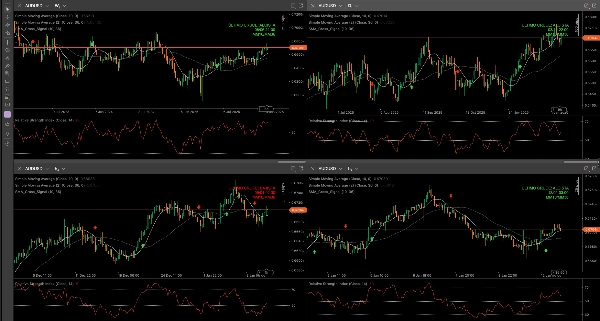
Saya menggunakannya serentak pada Mingguan, Harian, H4, dan H1 jangka masa pasangan mata wang yang sama.
Saya kebanyakannya mengambil entri pada H1, tetapi mempunyai penunjuk pada jangka masa yang lebih tinggi memberi saya pandangan keseluruhan yang sangat kuat tentang arah dominan pasangan tersebut:
- Adakah persilangan menaik/menurun sejajar di antara Mingguan dan Harian? → Kebarangkalian lebih tinggi
- Isyarat bertentangan antara jangka masa? → Lebih baik tunggu atau kurangkan saiz posisi
Konfigurasi popular yang berfungsi dengan baik:
- 9 / 21
- 10 / 30
- 21 / 50
- 50 / 200 (terutamanya berguna pada carta Mingguan dan Harian)
Sesuai untuk pemula (terima kasih kepada visual yang jelas dan kesederhanaannya) dan pedagang berpengalaman yang mencari asas yang bersih untuk digabungkan dengan Tindakan Harga, sokongan/rintangan, atau volum.
Sepenuhnya percuma untuk seluruh komuniti cTrader!
Cuba pada demo, gunakan dalam mod multi-jangka masa, dan jika anda menyukainya… jangan segan untuk tinggalkan komen dengan tetapan kegemaran anda atau pasangan di mana ia berfungsi terbaik untuk anda 😊
Selamat berdagang semua!
Ringkasan
Key features include non-repainting signals, prevention of duplicate alerts on the same bar, and log messages for each crossover event. The indicator is lightweight and compatible with any timeframe, making it suitable for multi-timeframe analysis. Commonly used SMA period pairs include 9/21, 10/30, 21/50, and 50/200, with the latter especially useful on weekly and daily charts.
Traders often apply the indicator simultaneously on weekly, daily, 4-hour, and 1-hour timeframes to gain a comprehensive view of market direction and improve entry timing. It supports various markets including Forex and popular symbols like EURUSD, GBPUSD, USDJPY, XAUUSD, and BTCUSD. The indicator is designed for both beginners and experienced traders seeking clear, straightforward moving average crossover signals.