Penerangan
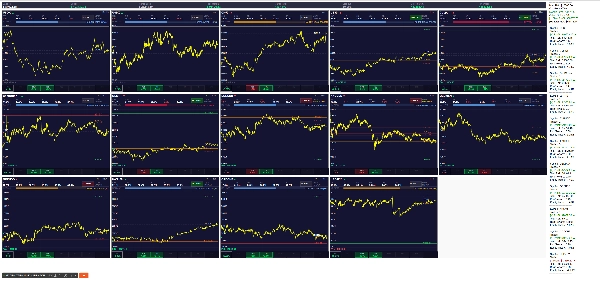
MiniChart Matrix ialah papan pemuka pemantauan multi-simbol profesional yang direka untuk pedagang aktif yang perlu menjejaki pelbagai pasaran serentak tanpa meninggalkan carta utama mereka.
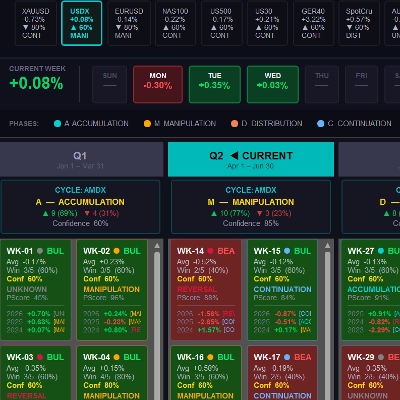
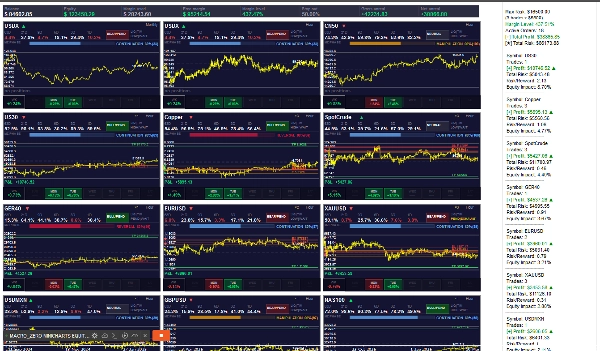
3 Grid Carta Tetap + Dinamik
Grid sentiasa memaparkan 3 simbol statik yang boleh dikonfigurasikan dalam slot pertama — setiap satu dengan jangka masa bebasnya sendiri — tanpa mengira sama ada anda mempunyai posisi terbuka. Slot yang tinggal secara automatik diisi dengan mana-mana simbol yang mempunyai posisi aktif, disusun secara masa nyata dari keuntungan bersih tertinggi ke terendah. Apabila posisi dibuka atau ditutup, grid dikemas kini secara automatik, memastikan perdagangan paling menguntungkan anda sentiasa di atas.
Mini-Carta Visual
Setiap slot memaparkan garis harga langsung, harga masuk, tahap Stop Loss dan Take Profit untuk mana-mana posisi aktif pada simbol itu, label harga berasaskan Fibonacci, dan garis bida semasa — semua dilukis terus pada lapisan carta anda dengan penyesuaian warna penuh.
Analisis Nisbah
Setiap mini-carta termasuk panel nisbah Badan-ke-Julat merentasi 6 jangka masa (1D, 3D, 6D, 9D, 21D, 63D). Ini membantu mengenal pasti fasa pengembangan bullish atau bearish, menilai keadaan kecairan (TINGGI/Rendah), dan mengesan keletihan masa — menyediakan bias arah yang berstruktur dan berasaskan data sebelum memasuki perdagangan.
Pengesanan Fasa MZ
Pengelasan fasa mingguan automatik mengenal pasti struktur pasaran semasa sebagai Pengumpulan, Manipulasi, Pengedaran, Sambungan, atau Pembalikan — dengan skor keyakinan dibina daripada data mingguan sejarah sehingga 10 tahun. Bar kemajuan berwarna memaparkan keyakinan fasa dengan sekilas untuk setiap simbol dalam grid.
Strip Prestasi Mingguan
Setiap mini-carta termasuk strip prestasi sesi demi sesi yang menunjukkan peratusan pulangan harian untuk setiap hari minggu semasa (AHAD hingga SABTU), serta pulangan mingguan terkumpul — semua berwarna hijau dan merah untuk bacaan visual segera.
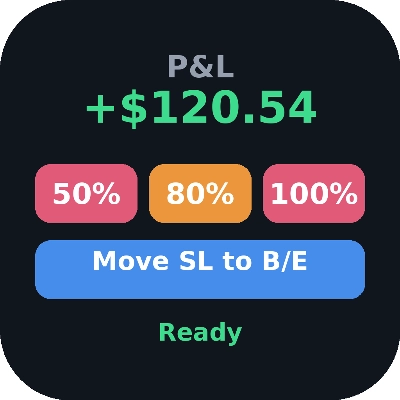
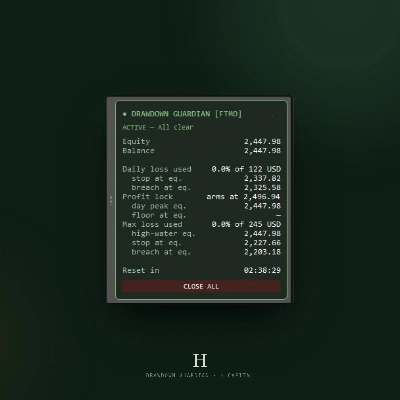
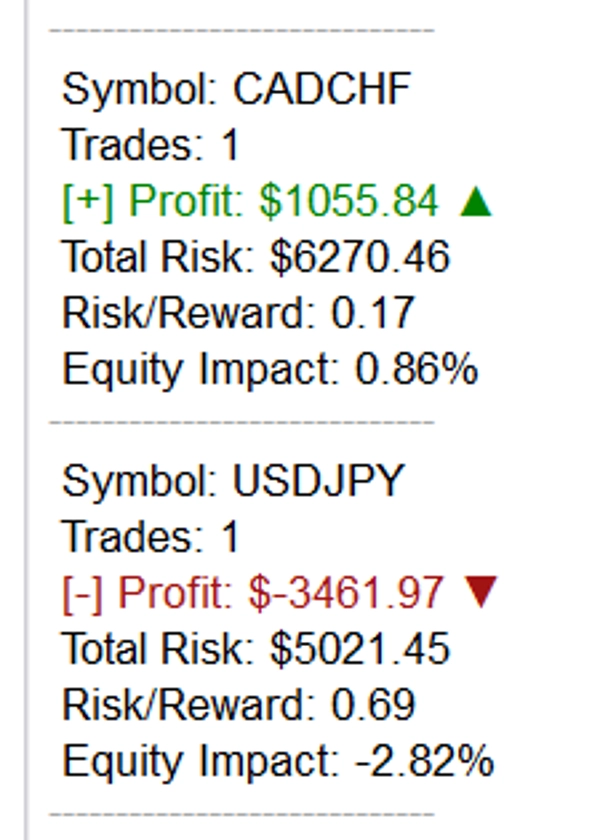
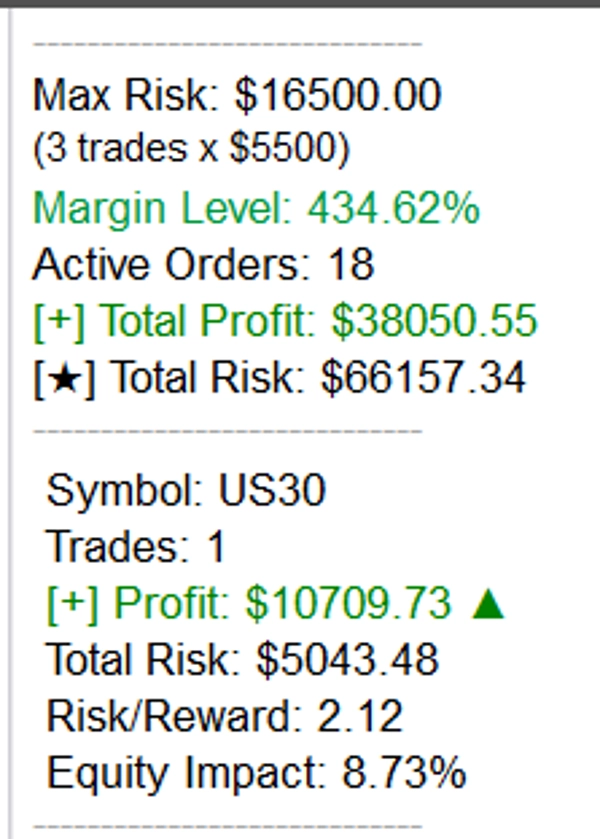
Pemantau Ekuiti & Risiko
Panel sisi khusus menjejaki akaun anda secara masa nyata: baki, ekuiti, tahap margin, margin percuma, P&L kasar dan bersih yang belum direalisasi, bilangan posisi aktif setiap simbol, pendedahan risiko keseluruhan, dan nisbah risiko/ganjaran — dikelompokkan mengikut simbol dan disusun mengikut keuntungan bersih, sentiasa mencerminkan keadaan akaun langsung anda.
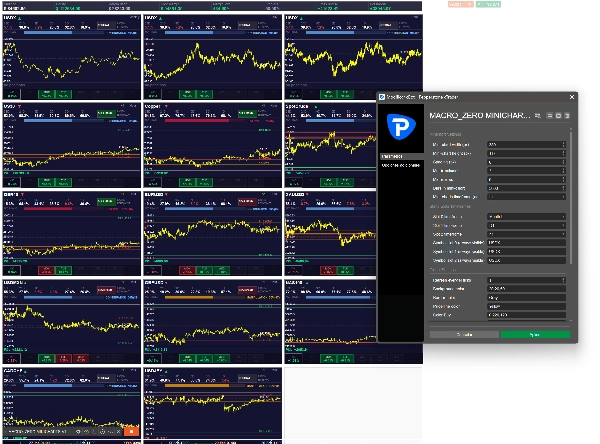
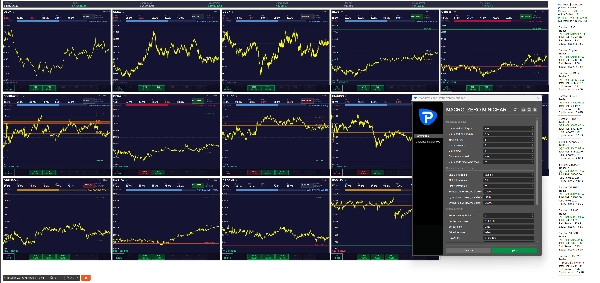
Penyesuaian Penuh
Saiz grid (lajur dan baris), dimensi carta, jangka masa setiap slot statik, kiraan bar, warna, offset UTC, kadar penyegaran, dan parameter risiko semuanya boleh dikonfigurasikan melalui panel parameter cBot.
Siapa yang sesuai?
Alat ini paling sesuai untuk pedagang budi bicara dan penganalisis multi-pasaran yang mengurus 5 hingga 20+ simbol serentak, yang menghargai ruang kerja visual yang bersih dan padat maklumat tanpa perlu menukar carta.
⚠️ Amaran Risiko: Perdagangan instrumen kewangan melibatkan risiko kerugian yang ketara dan mungkin tidak sesuai untuk semua pelabur. Prestasi lalu tidak menunjukkan hasil masa depan. Alat ini direka untuk tujuan maklumat dan pemantauan sahaja dan tidak merupakan nasihat kewangan. Sentiasa berdagang dengan bertanggungjawab dan hanya dengan modal yang anda mampu kehilangan.