present
Daftar dan dapatkan potongan bernilai $50 untuk pembelian pertama anda
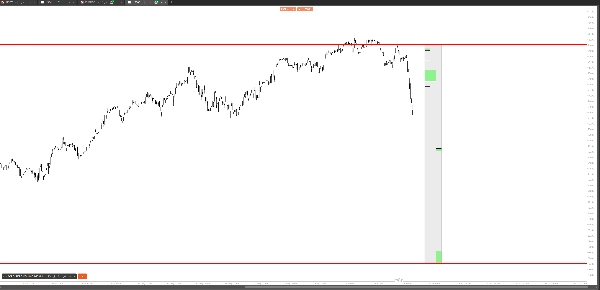
Trading product for MACRO_ZERO VOLUME IMBALANCE STRIP cBot Fair Value Gap Key Levels, image 1
MACRO_ZERO VOLUME IMBALANCE STRIP
cBot
Versi 1.0, Jun 2026
Windows, Mac, Web
5.0
Ulasan: 1
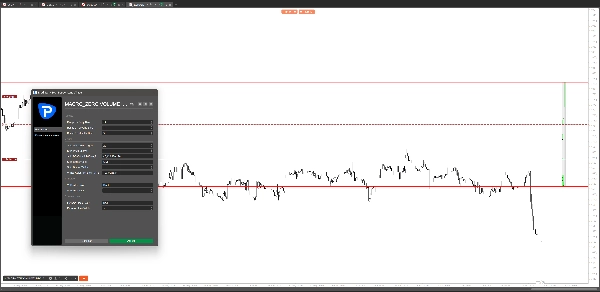
Trading product for MACRO_ZERO VOLUME IMBALANCE STRIP cBot Fair Value Gap Key Levels, image 2
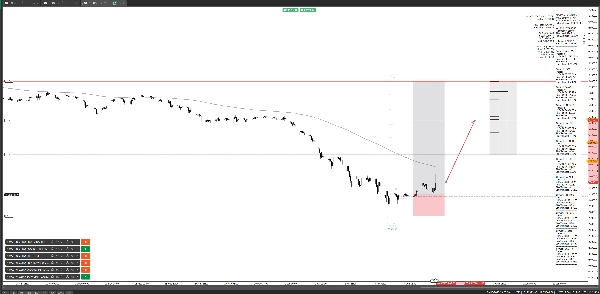
Trading product for MACRO_ZERO VOLUME IMBALANCE STRIP cBot Fair Value Gap Key Levels, image 3
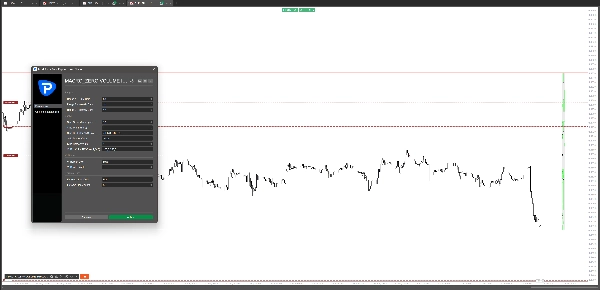
Trading product for MACRO_ZERO VOLUME IMBALANCE STRIP cBot Fair Value Gap Key Levels, image 4
Trading product for MACRO_ZERO VOLUME IMBALANCE STRIP cBot Fair Value Gap Key Levels, image 5
Trading product for MACRO_ZERO VOLUME IMBALANCE STRIP cBot Fair Value Gap Key Levels, image 6
13.15M
Volum yang didagangkan
168.91K
Pip dimenangi
2
Jualan

Penerangan

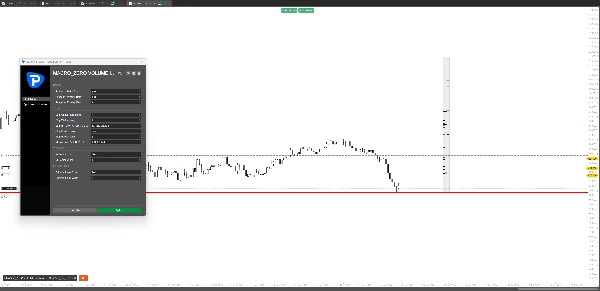
APA YANG DILAKUKANNYA Melukis tiga jalur menegak berdampingan terus pada carta anda, masing-masing mewakili zon ketidakseimbangan volum yang dikesan merentasi jangka masa Harian, Mingguan, dan Bulanan secara serentak. Ketiga-tiga jalur berkongsi tinggi dan rendah global yang sama — bahagian atas tertinggi dan bawah terendah merentasi semua ketidakseimbangan yang dikesan — memberikan anda rujukan visual segera bagi julat ketidakseimbangan penuh yang sedang dimainkan. Dua garis mendatar merah menandakan tahap ketidakseimbangan tertinggi dan terendah mutlak merentasi ketiga-tiga jangka masa dan semua julat bar yang dipilih — ini adalah tahap makro utama anda. Harga mempunyai kecenderungan semula jadi untuk mengunjungi semula ekstrem ini, menjadikannya titik rujukan yang kuat untuk sasaran, penempatan hentian, dan konteks tren. BERDAGANG DENGAN KETIDAKSEIMBANGAN Zon ketidakseimbangan volum — juga dikenali sebagai jurang nilai adil — adalah kawasan harga di mana pasaran bergerak dengan agresif tanpa penyertaan dua hala. Ketidakefisienan ini bertindak sebagai magnet. Harga sentiasa kembali untuk mengisi atau bertindak balas pada tahap ini, menjadikan setiap zon kawasan berkemungkinan tinggi untuk: — Reaksi sokongan dan rintangan — Titik masuk tepat pada penarikan balik — Sasaran keuntungan pada pergerakan sambungan — Zon konfluens apabila selari merentasi jangka masa Apabila ketidakseimbangan Harian, Mingguan, dan Bulanan bertindih pada tahap harga yang sama, konfluens itu menjadi salah satu kawasan terkuat pada carta anda. Panel jalur menjadikan penjajaran ini kelihatan serta-merta — tiada analisis manual diperlukan. PANEL TIGA JALUR Setiap jalur sepadan dengan satu jangka masa — Harian di kiri, Mingguan di tengah, Bulanan di kanan. Jalur dilukis di sebelah kanan bar terakhir pada offset yang boleh dikonfigurasi, duduk rapat antara satu sama lain dengan sempadan individu supaya setiap jangka masa jelas dipisahkan. Latar belakang merentasi julat global penuh; kotak ketidakseimbangan dilukis pada tahap harga tepat mereka di dalam setiap jalur. Penafian Risiko: Perdagangan instrumen kewangan melibatkan risiko kerugian yang besar. Zon ketidakseimbangan volum adalah rujukan analitik sahaja dan tidak menjamin tindak balas harga. Alat ini tidak merupakan nasihat kewangan. Sentiasa gunakan pengurusan risiko yang betul. ⚠️ Amaran Risiko: Tingkah laku harga lalu di zon ketidakseimbangan tidak menunjukkan hasil masa depan. Berdagang dengan bertanggungjawab dan hanya dengan modal yang anda mampu kehilangan.

Ringkasan

Ringkasan AI
MACRO_ZERO VOLUME IMBALANCE STRIP is a multi-timeframe volume imbalance visualization tool designed for cTrader. It displays three vertical strips side-by-side on the chart, each representing volume imbalance zones—also known as fair value gaps—detected on Daily, Weekly, and Monthly timeframes. These strips share a common global high and low, highlighting the full range of imbalances across all timeframes. Two red horizontal lines mark the absolute highest and lowest imbalance levels, serving as key macro reference points.

Volume imbalance zones indicate price areas where market moves occurred with limited two-sided participation, often acting as magnets where price tends to revisit. This tool helps identify high-probability areas for support and resistance reactions, precision entries on pullbacks, profit targets on continuation moves, and confluence zones when imbalances align across multiple timeframes.

The three-strip panel is positioned to the right of the last bar with configurable offset and clear borders separating each timeframe. The background spans the full global imbalance range, with imbalance boxes drawn at exact price levels within each strip. This visualization aids traders in quickly assessing macro-level volume imbalances without manual analysis.
Profil dagangan

Perbincangan

Ulasan pelanggan

5.0
Ulasan: 1
5
100 %
4
0 %
3
0 %
2
0 %
1
0 %
Ulasan pelanggan
July 2, 2026
An innovative visualization tool for ICT and SMC traders that compresses Daily, Weekly, and Monthly volume imbalance analysis into a compact three-strip panel. The indicator excels at identifying multi-timeframe confluence zones while keeping the chart clean and readable. Best suited for experienced discretionary traders working with market structure and fair value gap concepts.

Soalan Lazim

Fair Value Gap
Key Levels
Imbalance
Volume
Support & Resistance
Produk yang tersedia melalui cTrader Store, termasuk bot dagangan, indikator dan plugin, disediakan oleh pembangun pihak ketiga dan diberikan akses untuk tujuan maklumat dan teknikal sahaja. cTrader Store bukan broker dan tidak memberikan nasihat pelaburan, syor peribadi atau sebarang jaminan prestasi masa hadapan.

Lebih banyak produk daripada penulis ini

cBot
ADX
ATR
+5
Analyze quarterly cycles and weekly seasonality patterns across multiple instruments with historical bias data
cBot
Forex
BTCUSD
+5
HTF candles (1H, 4H, 8H, 12H, 16H, 1D, 20D, 1W, 1M) Charts (15M-Daily).
cBot
SMC
Forex
+5
Advanced volatility calculator with OB/BB Block detection and real-time alert system for analysis
Indikator
ATR
Breaker Block
+5
Display your symbol, timeframe or custom text as a watermark on any chart position with full color and size control.
cBot
Key Levels
SL Manager
+4
Multi-symbol dashboard with 3 fixed charts, dynamic position slots ranked by profit, Ratio analysis, MZ phase detection
cBot
Key Levels
SL Manager
+4
RISK REWARD VISUALIZER Part of the MACRO ZERO Suite Visualize your active positions, pending orders, and cl
cBot
SMC
Forex
+5
Multi-timeframe OHLC bars + projection levels from session analysis. Alerts on key level crosses. No trading execution.

Anda juga mungkin suka

cBot
ATR
Grid
+3
“University-Built Gold–Silver Arbitrage Bot: +439k USD with 5k Capital (backtest in 3 years)”
2
Faktor keuntungan
cBot
Prop Firm Fit
Daily Loss Limit
Prop-firm rule monitor for cTrader: 12 rules, daily loss and drawdown alerts, early warning and optional auto-close.
cBot
XAU/USD SWING BOT
cBot
Forex
Automate Fibonacci trading with this cTrader cBot—advanced risk management, alerts, and seamless order execution.
cBot
ATR
EMA
+5
Incorporate EMA, RSI, and ATR to detect strong trends and execute precise entries
cBot
ATR
RSI
+5
📊 EMA CROSS COMPLETE BOT - Professional Trading System
2.1
Faktor keuntungan
cBot
Automatiza tus operaciones con esta estrategia de cruce de medias móviles exponenciales (EMAs). EMA Crossover Pro.
cBot
Forex
Crypto
+2
The cTrader Risk & Reward management tool can easily help you to set the risk vs reward values
cBot
AI
RSI
+4
Smart Trend Trading Bot, Best Trend Identified, Please try default setting before making any changes
cBot
Fixed Risk %
Market Structure
Gold Edge trades XAUUSD using market-structure swing detection, fixed-percentage risk per trade, a minimum RR
1.13
Faktor keuntungan
cBot
AI
ATR
+27
TrustGuard - Simple, Smart Account Protection for cTrader
cBot
ATR
MSS
+5
🚀 Automate trendline breakouts with smart BUY/SELL signals, optional trend filters, structure exits, USD risk control
26.5%
ROI
1.8
Faktor keuntungan
cBot
EMA
SL Manager
+5
Fully automated dual-symbol hedging cBot for cTrader.
20.6%
ROI
8.66
Faktor keuntungan
cBot
Prop
Forex
+5
PivotPointsBot, leveraging the time-tested pivot point strategy!
cBot
RSI
Indices
This bot is made of Fibonacci, EMA and RSI.
cBot
SL Manager
TP Manager
+5
Risk-based entries, draggable SL/TP, partial TPs, break-even, 6 trailing modes and daily equity guard in one panel.
1
Faktor keuntungan
cBot
ATR
EMA
+5
Momentum driven, Compounding. Volatility adaptive EMA BOLLINGER ATR base Strategy
93.4%
ROI
1.31
Faktor keuntungan
cBot
Forex
BTCUSD
+7
Fully functional demo runs until January 31, 2026 with over 100% ROI within 14 days

Harga

13.15M
Volum yang didagangkan
168.91K
Pip dimenangi
2
Jualan