Trading product for SMA_Cross_Signal Wskaźnik BTCUSD Forex, image 1
Wskaźnik
121 pobrania
Wersja 1.0, Jan 2026
Windows, Mac
Trading product for SMA_Cross_Signal Wskaźnik BTCUSD Forex, image 2
Od 10/03/2025
121
Bezpłatne instalacje

Opis

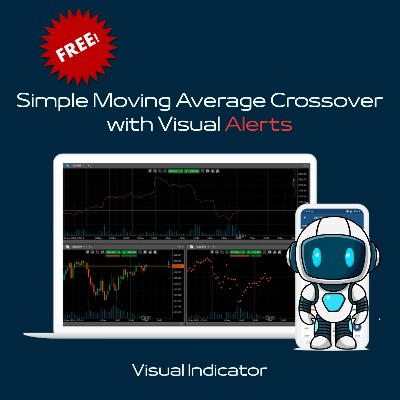
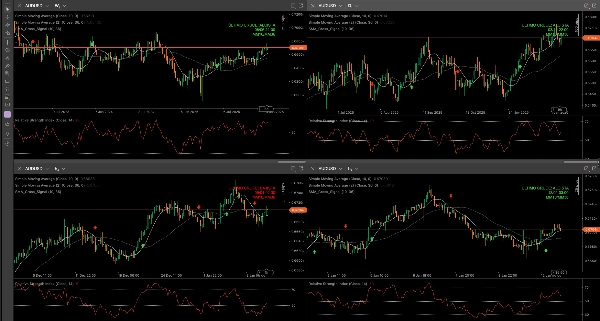
Czysty, prosty i bardzo wizualny wskaźnik, który wykrywa przecięcia między dwoma prostymi średnimi kroczącymi (SMA) i wyraźnie wyświetla wszystko na wykresie.

Kluczowe cechy:

  • Duże kolorowe strzałki dokładnie w punkcie przecięcia → Limonkowa zieleń ↑ → Bycze przecięcie (potencjalny zakup) → Czerwona ↓ → Niedźwiedzie przecięcie (potencjalna sprzedaż)
  • Stały panel statusu w prawym górnym rogu wykresu → Typ najnowszego przecięcia (BYCZE / NIEDŹWIEDZIE / OCZEKIWANIE) → Dokładna data i godzina przecięcia → Skonfigurowane okresy średnich kroczących
  • 100% bez przerysowań
  • Zapobiega powielaniu sygnałów na tym samym słupku
  • Wysyła komunikaty do logu za każdym razem, gdy następuje przecięcie (świetne do śledzenia)
  • Bardzo lekki – działa doskonale na każdym interwale czasowym

Mój ulubiony sposób użycia (i ten, który polecam):

Stosuję go jednocześnie na Tygodniowym, Dziennym, H4 i H1 interwale tego samego pary walutowej.

Głównie dokonuję wejść na H1, ale posiadanie wskaźnika na wyższych interwałach daje mi bardzo silny ogólny obraz dominującego kierunku pary:

  • Czy bycze/niedźwiedzie przecięcia są zgodne na Tygodniowym i Dziennym? → Wyższe prawdopodobieństwo
  • Sprzeczne sygnały między interwałami? → Lepiej poczekać lub zmniejszyć wielkość pozycji

Popularne konfiguracje, które dobrze działają:

  • 9 / 21
  • 10 / 30
  • 21 / 50
  • 50 / 200 (szczególnie przydatne na wykresach Tygodniowych i Dziennych)

Idealny zarówno dla początkujących (dzięki jasnym wizualizacjom i prostocie), jak i doświadczonych traderów szukających czystej bazy do łączenia z Price Action, wsparciem/oporem lub wolumenem.

Całkowicie darmowy dla całej społeczności cTrader!

Wypróbuj na demo, stosuj w trybie wielointerwałowym, a jeśli Ci się spodoba… śmiało zostaw komentarz z ulubionymi ustawieniami lub parą, na której działa najlepiej dla Ciebie 😊

Szczęśliwego handlu wszystkim!

Podsumowanie

Podsumowanie AI
SMA Cross Signal is a visual trading indicator that identifies crossovers between two Simple Moving Averages (SMAs) on a chart. It marks bullish crossovers with lime green upward arrows and bearish crossovers with red downward arrows at the exact crossover points. A permanent status panel in the chart’s top-right corner displays the latest crossover type (Bullish, Bearish, or Waiting), the exact date and time of the crossover, and the configured SMA periods.
Key features include non-repainting signals, prevention of duplicate alerts on the same bar, and log messages for each crossover event. The indicator is lightweight and compatible with any timeframe, making it suitable for multi-timeframe analysis. Commonly used SMA period pairs include 9/21, 10/30, 21/50, and 50/200, with the latter especially useful on weekly and daily charts.
Traders often apply the indicator simultaneously on weekly, daily, 4-hour, and 1-hour timeframes to gain a comprehensive view of market direction and improve entry timing. It supports various markets including Forex and popular symbols like EURUSD, GBPUSD, USDJPY, XAUUSD, and BTCUSD. The indicator is designed for both beginners and experienced traders seeking clear, straightforward moving average crossover signals.

Profil wskaźnika

Opinie klientów

0.0
Opinie: 0
Opinie klientów
Ten produkt nie ma jeszcze opinii. Wypróbowałeś(-aś) go już? Bądź pierwszy(-a) i powiedz o tym innym!

Dyskusja

Częste pytania

BTCUSD
Forex
Signal
EURUSD
GBPUSD
XAUUSD
USDJPY
Produkty dostępne za pośrednictwem cTrader Store, w tym boty handlowe, wskaźniki i wtyczki, dostarczane są przez deweloperów zewnętrznych i udostępniane wyłącznie w celach informacyjnych oraz w celu zapewnienia dostępu technicznego. cTrader Store nie jest brokerem i nie zapewnia doradztwa inwestycyjnego, nie udziela spersonalizowanych rekomendacji ani nie gwarantuje przyszłych wyników.

Możesz także polubić

Wskaźnik
The Multi-Timeframe Candle Indicator displays candles from multiple timeframes in one window, enhancing market analysis!
Wskaźnik
Prop
Forex
+4
The Smooth Heiken Ashi indicator is a refined charting tool designed to filter out market noise and highlight true price
Wskaźnik
Indices
Multi-Timeframe ADX Trend Dots & Arrows
Wskaźnik
Counts bars from the start of the sessions.
Wskaźnik
SMC
VWAP
+4
Killzone Session and key levels with VWAP – Precision Meets Price Action
Wskaźnik
BOS
CHOCH
+1
Maps unmitigated SMC swing points. Draws infinite structure lines until price touches them, labeling BOS & CHoCH breaks.
Wskaźnik
SMC
Forex
+5
Pure Price Action ICT Tools
Wskaźnik
Shows daily and sessions highs / lows and session boxes, everything configurable
Wskaźnik
Prop
Forex
+15
The best filter for trading trend continuations on Renko charts.
Wskaźnik
Auto-detect supply & demand zones, remove broken levels, and trade smarter with real-time alerts. Precision made simple.
Wskaźnik
ATR
RSI
+5
One of the best indicators we have ever developed, with a very high profit ratio.
Wskaźnik
ZigZag Pro – Multi-Swing Indicator for cTrader Description: ZigZag Pro is a powerful and fully customizable swing indica
Wskaźnik
MSS
AI-assisted
+5
Live ICT Silver Bullet detection: liquidity sweeps, structure shifts, and killzone-gated FVGs, graded and glowing in rea
Wskaźnik
Volume
Key Levels
+1
Order book indicator .Don't trade against the flow. Trade with the truth!
Wskaźnik
SMC
Prop
+8
KILLZONES AND MACRO SESSIONS
Wskaźnik
Signal
USDJPY
See USD demand in one line—Composite OBV fuses six major FX pairs into a clear momentum gauge.
Wskaźnik
Fibonacci
Clear pivot levels. Clean S/R zones. Five methods. Any timeframe.
Wskaźnik
🇫🇷 Visualisez vos sessions de marché et OPR d'un coup d’œil 🇬🇧 Visualize your market sessions & OPR at a glance !

Cena

Od 10/03/2025
121
Bezpłatne instalacje