
RegressionChannelV2
อินดิเคเตอร์
เวอร์ชัน 1.0, Jan 2026
Windows, Mac
4.6
รีวิว: 3
ตั้งแต่ 31/01/2025
438.78M
ปริมาณการเทรด
2.76M
Pips ที่ได้กำไร
4
การขาย
187
ติดตั้งฟรี
คำอธิบาย
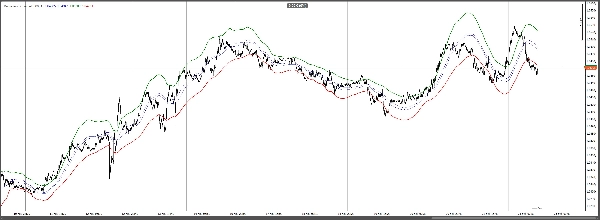
Regression Channel เป็นเครื่องมือแสดงแนวโน้มและความผันผวนที่วาดช่องทางเรียบรอบราคาหุ้น มันคำนวณขอบเขตบนและล่างที่ปรับตัวได้ตามพฤติกรรมตลาดล่าสุด ช่วยให้คุณสามารถระบุทิศทางที่เป็นอยู่ วัดการขยาย/หดตัวของความผันผวน และระบุการเคลื่อนไหวที่อาจเกินขอบเขตได้อย่างรวดเร็ว
ใช้เพื่อ:
- ยืนยันทิศทางและความแข็งแกร่งของแนวโน้ม
- เน้นโซนการกลับตัวเข้าสู่ค่าเฉลี่ยใกล้ขอบช่อง
- ตรวจจับการเบรกเอาต์เมื่อราคาผลักดันเกินขอบเขต
- ปรับปรุงจุดเข้า/ออกโดยการรวมกับสัญญาณที่คุณมีอยู่
พารามิเตอร์:
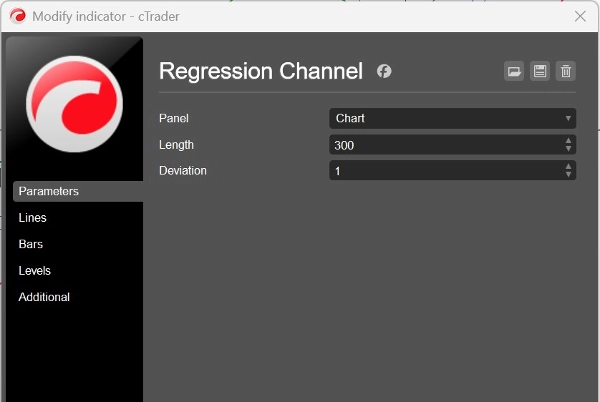
- Length: หน้าต่างย้อนหลังที่ใช้สำหรับการคำนวณช่องทาง
- Deviation: ตัวคูณความกว้างของแถบที่ควบคุมความแคบหรือกว้างของช่องทาง
สรุป
AI summary
RegressionChannelV2 is a technical indicator that plots dynamic upper and lower bands around price to visualize trend direction and volatility. It calculates adaptive boundaries based on recent market data, forming a smooth channel that helps identify the prevailing trend, measure volatility changes, and detect potential overextended price moves. Key uses include confirming trend strength, highlighting mean-reversion zones near channel edges, spotting breakouts when price moves beyond the channel, and enhancing trade entries and exits when combined with other signals. The indicator’s parameters include Length, which sets the lookback window for channel calculation, and Deviation, which adjusts the channel width by controlling band tightness. It supports various markets and symbols such as Forex (EURUSD, GBPUSD, NZDUSD, USDJPY), cryptocurrencies (BTCUSD, crypto), commodities (XAUUSD, gold, oil), indices (NAS100, SP500, DAX), and stocks. This tool is suitable for traders seeking visual trend and volatility analysis across multiple asset classes.
โปรไฟล์อินดิเคเตอร์
รีวิวจากลูกค้า
4.6
รีวิว: 3
5 | 67 % | |
4 | 33 % | |
3 | 0 % | |
2 | 0 % | |
1 | 0 % |
รีวิวจากลูกค้า
January 24, 2026
Messy entries become more obvious, but the market context still matters.
January 23, 2026
direction is easier to respect, but the trade log should confirm the value.
January 19, 2026
The setup is easier to scan, but messy settings can create bad signals.
การสนทนา
คำถามที่พบบ่อย
BTCUSD
Forex
Signal
Breakout
Indices
EURUSD
Commodities
GBPUSD
NZDUSD
Prop
Scalping
Crypto
Stocks
XAUUSD
NAS100
USDJPY
ผลิตภัณฑ์ที่มีให้บริการผ่าน cTrader Store รวมถึงบอทการเทรด อินดิเคเตอร์ และปลั๊กอิน มีให้บริการโดยนักพัฒนาบุคคลที่สามและมีไว้เพื่อวัตถุประสงค์ในการเข้าถึงข้อมูลและทางเทคนิคเท่านั้น cTrader Store ไม่ใช่โบรกเกอร์และไม่ได้ให้คำแนะนำการลงทุน คำแนะนำส่วนบุคคล หรือการรับประกันผลการดำเนินงานในอนาคต





















ราคา
ตั้งแต่ 31/01/2025
438.78M
ปริมาณการเทรด
2.76M
Pips ที่ได้กำไร
4
การขาย
187
ติดตั้งฟรี