present
Zarejestruj się i otrzymaj 50 $ zniżki na pierwszy zakup
Trading product for Volume_Momentum_HeatMap-Liquidity-style Wskaźnik Scalping Key Levels, image 1
Volume_Momentum_HeatMap-Liquidity-style
Wskaźnik
Wersja 2.0, Apr 2026
Windows, Mac
4.5
Opinie: 4
Trading product for Volume_Momentum_HeatMap-Liquidity-style Wskaźnik Scalping Key Levels, image 2
Trading product for Volume_Momentum_HeatMap-Liquidity-style Wskaźnik Scalping Key Levels, image 3
Trading product for Volume_Momentum_HeatMap-Liquidity-style Wskaźnik Scalping Key Levels, image 4
Trading product for Volume_Momentum_HeatMap-Liquidity-style Wskaźnik Scalping Key Levels, image 5
Od 23/04/2025
2
Sprzedaż

Opis

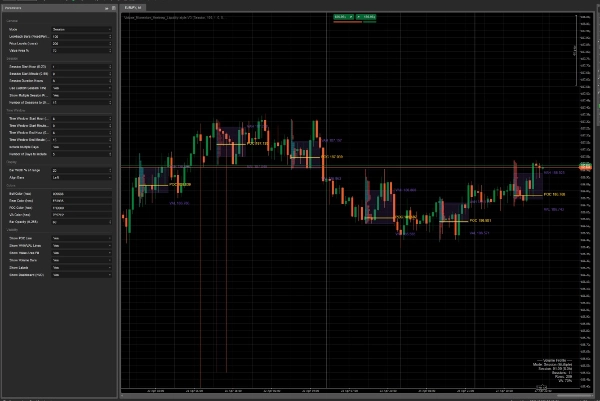
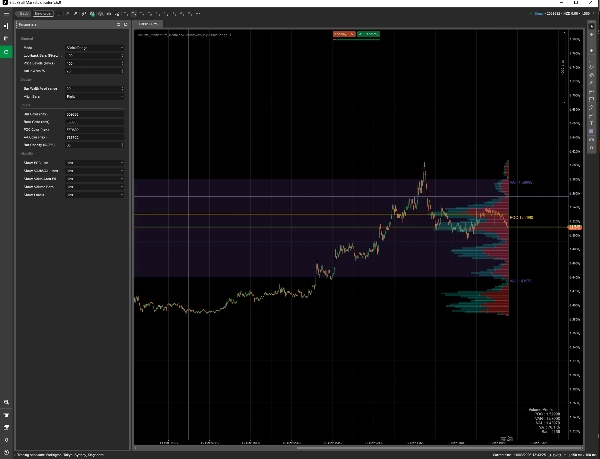
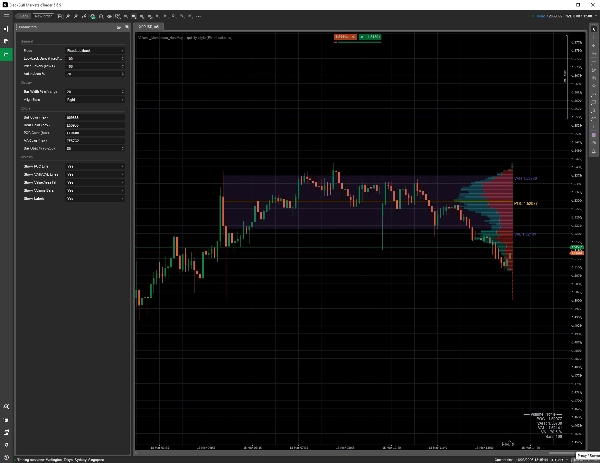
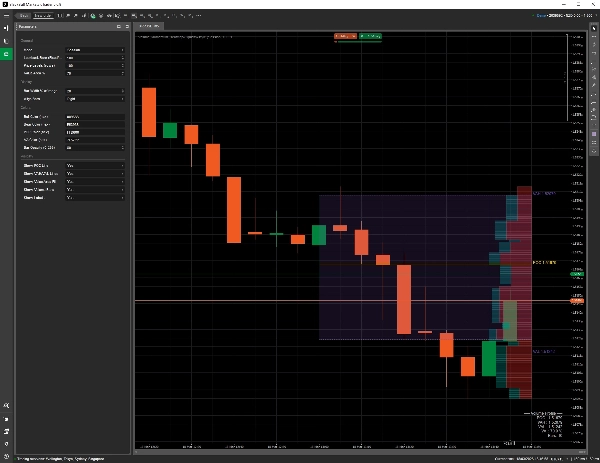
Volume Profile HeatMap to wskaźnik wykresu cTrader do analizy, gdzie aktywność handlowa skoncentrowała się na różnych poziomach cenowych. Rysuje mapę cieplną w stylu profilu wolumenu z POC, obszarem wartości oraz opcjonalnymi wizualnymi znacznikami scenariuszy handlowych.


Co robi:

- Wyświetla mapę cieplną w stylu profilu wolumenu bezpośrednio na wykresie

- Podkreśla POC, VAH, VAL, węzły o wysokim wolumenie oraz obszary o niskim wolumenie

- Obsługuje tryby widocznego zakresu, stałego okresu wstecz, sesji i okna czasowego

- Może wyświetlać wiele profili sesji

- Rysuje opcjonalne wypełnienie obszaru wartości, rozszerzone strefy obszaru wartości, etykiety i informacje na panelu

- Zawiera opcjonalne etykiety wzorców i strzałki sygnałowe do wizualnego planowania handlu

- Rysuje wizualne scenariusze wejścia, stopu i celu, gdy są włączone


Podejście do handlu:

Wskaźnik jest przeznaczony dla traderów, którzy używają koncentracji wolumenu, obszaru wartości i kontekstu sesji do planowania ręcznych transakcji. Pomaga identyfikować strefy, gdzie cena wcześniej akceptowała lub odrzucała wartość, ale nie gwarantuje, że te strefy utrzymają się w warunkach rzeczywistego rynku.


Kluczowe parametry:

- Tryb profilu

- Liczba świec wstecz

- Czas rozpoczęcia sesji i jej czas trwania

- Liczba sesji do wyświetlenia

- Rozpoznawanie wzorców i strzałki sygnałowe

- Wybór okna czasowego

- Liczba poziomów cenowych

- Procent obszaru wartości

- Szerokość i wyrównanie świec

- Widoczność POC, VAH, VAL, wypełnienia obszaru wartości, etykiet i panelu

- Stosunek ryzyka do zysku dla wizualnych scenariuszy handlowych


Dla kogo jest przeznaczony:

- Traderzy intraday korzystający z poziomów obszaru wartości i POC

- Traderzy szukający wizualnego kontekstu wsparcia i oporu

- Traderzy manualni, którzy chcą nakładkę w stylu profilu wolumenu w cTrader

- Testerzy strategii chcący przeglądać zachowanie sesji i potencjalne strefy reakcji


Ważne ograniczenia:

To jest wskaźnik, nie robot handlowy. Nie wysyła zleceń na żywo. Markery transakcji to tylko wizualne scenariusze. Wskaźnik używa danych wolumenowych wykresu/brokera dostępnych w cTrader, które mogą różnić się od danych wolumenu z centralnej giełdy lub danych przepływu zleceń futures.


Uwaga o ryzyku:

Handel wiąże się z ryzykiem. Strefy POC, VAH, VAL, HVN i LVN to narzędzia analityczne, a nie gwarantowane poziomy odwrócenia lub wybicia. Testuj ustawienia na demo i stosuj niezależne zarządzanie ryzykiem.


Podsumowanie

Podsumowanie AI
Volume_Momentum_HeatMap-Liquidity-style is a cTrader chart indicator designed to visualize trading volume concentration across price levels using a volume-profile heatmap. It highlights key volume-based zones such as Point of Control (POC), Value Area High (VAH), Value Area Low (VAL), High Volume Nodes (HVN), and Low Volume Nodes (LVN). The indicator supports multiple profile modes including visible range, fixed lookback, session, and customizable time windows, allowing users to display one or multiple session profiles.

Key features include optional value area fills, extended value area zones, labels, and a dashboard for summary information. It also offers pattern recognition with signal arrows and visual trade scenario markers such as entry, stop, and target levels based on configurable risk/reward ratios. Users can adjust parameters like profile mode, lookback bars, session timing, number of price levels, and visibility of various elements to tailor the analysis.

This tool is intended for intraday and manual traders who utilize volume profile, value areas, and session context to identify support and resistance zones and plan trades visually. It relies on chart volume data available in cTrader and does not execute trades automatically. The indicator serves as an analytical overlay to assist in trade planning and session behavior review.
Profil wskaźnika
Kategoria wskaźnika
Dynamika
Typ wyjścia
Wizualizacja
Sygnały
Filtr
Wymagania dotyczące danych
Wolumen
Obsługiwane sygnały
Zmienność
Dotknięcie poziomu
Zakres otwarcia sesji

Opinie klientów

4.5
Opinie: 4
5
50 %
4
50 %
3
0 %
2
0 %
1
0 %
Opinie klientów
March 31, 2026
Not some auto win thing, but it has a clear role. It helps with smart money style analysis, while the weak spot is that zones still need manual validation. Early sizing should stay modest until the journal looks stable.
March 24, 2026
Tbh the value is mostly in filtering bad ideas. I still would not trust it live without checking the chart myself. The weak spot shows up when risk stops matching the setup.705 caution area.
March 22, 2026
the product feels more useful when the plan is already written down. A 97 setup run on daily close keeps the review grounded.
March 22, 2026
After 3 sessions, the useful part became clearer. 20 FVG reactions was enough to see whether it helped, and 0.5 mitigation kept the test grounded.

Dyskusja

Częste pytania

Scalping
Key Levels
Volume
Support & Resistance
Produkty dostępne za pośrednictwem cTrader Store, w tym boty handlowe, wskaźniki i wtyczki, dostarczane są przez deweloperów zewnętrznych i udostępniane wyłącznie w celach informacyjnych oraz w celu zapewnienia dostępu technicznego. cTrader Store nie jest brokerem i nie zapewnia doradztwa inwestycyjnego, nie udziela spersonalizowanych rekomendacji ani nie gwarantuje przyszłych wyników.

Więcej od tego autora

Logo „ORB_Dashboard”
Najwyżej oceniane
4.5
(7)
$25
Wskaźnik
Signal
Trades Opening Range Breakouts Indicator with dynamic stops/targets adapting to market volatility.

Możesz także polubić

Wskaźnik
Volume
Fibonacci
+5
Classic 9:30 Opening Range Breakout — auto-plots the range, flags volume-confirmed breakouts long or short, live.
Wskaźnik
Volume
Imbalance
+5
Professional OrderFlow Footprint Analysis ( Bid/ask, POC, VA, Delta, Absorption, Imbalance )
Wskaźnik
RSI
Forex
+7
Advanced S/R + liquidity zone detector with auto-configured trade styles. Generates filtered entry signals with TP/SL.
Wskaźnik
CHOCH
Fair Value Gap
+2
Advanced FVG & IFVG indicator with multi-timeframe confluence, CHoCH filtering, and smart mitigation.
Wskaźnik
ATR
RSI
+2
This indicator works best as a trend-confirmation tool—wait for multiple signals!
Wskaźnik
ATR
Channel
+3
Catch trend with precision. BUY/SELL arrows, real-time dashboard, sound alerts and ATRchannel. Works on all markets.
Wskaźnik
Forex
BTCUSD
+11
Master trends with Smart ADX: MTF Scanner, precise Buy/Sell signals, Divergence & clear Exit targets 🎯
Wskaźnik
Forex
Fibonacci
+2
Enhance your trading with customizable alerts and dynamic visual tools for trendlines, Fibonacci levels, and more.
Wskaźnik
BOS
CHOCH
+3
Smart Money Concepts Pro v5.1 for cTrader is a structural market analysis indicator that identifies swings, BOS, CHoC
Wskaźnik
VWAP
Volume
+4
Advanced Order Flow & Volume Profiling for cTrader. Unveil institutional footprints, Delta, and Anchored VWAPs.
Wskaźnik
ATR
Forex
+3
Order Block - Market Structure Signals - This is one of the main indicators in the Market Structure trading system
Wskaźnik
VWAP
Volume
+4
Volume Profile + VWAP with Standard Deviations
Wskaźnik
RSI
Breakout
+1
📊 Liquidation Map: Potential areas where highly leveraged investors might face liquidations.
Wskaźnik
SMC
Prop
+5
Automatically draws the Opening Range (High & Low) for Tokyo, London, and New York sessions. Configurable start times,
Wskaźnik
Liquidity Grab
Liquidity Sweep
+2
Visualizes accumulation ranges, manipulation sweeps and distribution phases on your cTrader chart.
Wskaźnik
Prop
Institution-level trend Analyzer.
Wskaźnik
Imbalance
Risk Dashboard
+2
FX‑DESK RISK MANAGEMENT — Cross‑Asset Correlation Heatmap, Info Panel & Trade Signals
Wskaźnik
Forex
Crypto
+5
ICT Order Block Advanced

Cena

Od 23/04/2025
2
Sprzedaż