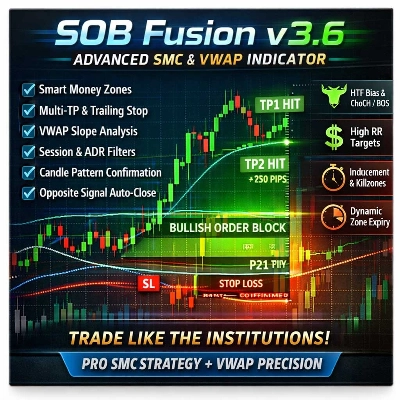
Opis
PROPFOLIO MASTER SUITE: INSTRUKCJA OBSŁUGI
Platforma: cTrader Wersja: 1.0 (Wersja zgodna ze sklepem) Dostarczone przez: Propfolio Solutions
Witamy w PropFolio Peak Formation SMC Dashboard. To kompletne instytucjonalne narzędzie do wykresów, zaprojektowane, aby połączyć Smart Money Concepts (SMC), śledzenie Beat The Market Maker (BTMM) oraz analizę Volume Profile w jednym lekkim, wysoko zoptymalizowanym wskaźniku cTrader.
📥 1. PRZEWODNIK INSTALACJI
- Pobierz plik
PropFolioPeakFormationSMCDashbaord.algo. - Kliknij dwukrotnie plik
.algo. cTrader automatycznie się otworzy i zainstaluje go. - Otwórz dowolny wykres w cTrader.
- Kliknij prawym przyciskiem myszy na wykres -> Wskaźniki -> Niestandardowe -> Wybierz PropFolioPeakFormationSMCDashbaord.
- Kliknij OK, aby zastosować.
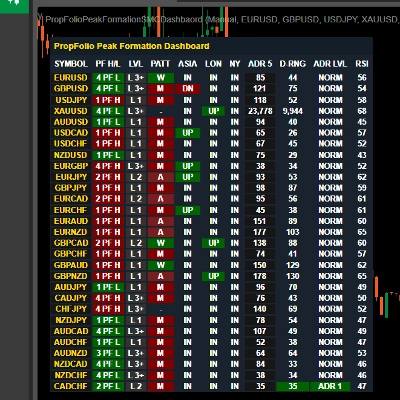
📊 2. WYJAŚNIENIE PANELU
Pakiet zawiera wielosymbolowy panel, który śledzi instytucjonalne stany rynku w czasie rzeczywistym w 11 kolumnach.
- SYMBOL: Para walutowa, którą śledzimy. Możesz zdefiniować własną listę w ustawieniach wskaźnika.
- PF H/L (Peak Formation): Pokazuje, czy obecny 5-dniowy cykl znajduje się na szczycie formacji (PFH) lub na dnie formacji (PFL) oraz ile dni temu się uformował.
- LVL (Poziom): Obecny poziom cyklu BTMM (Poziom 1, Poziom 2 lub Poziom 3+).
- PATT (Wzór): Identyfikuje instytucjonalne wzory wewnątrzdniowe.
-
- M / W: Standardowe formacje M i W.
- A / V: Formacje A-Tops i V-Bottoms.
- ASIA / LON / NY: Pokazuje aktualny stan ceny względem zakresu danej sesji.
-
- UP (Zielony): Cena przebiła się powyżej maksimum sesji.
- DN (Czerwony): Cena przebiła się poniżej minimum sesji.
- IN (Szary): Cena porusza się w obrębie zakresu sesji.
- ADR 5: Średni dzienny zakres z ostatnich 5 dni (w pipsach).
- D-RNG: Aktualny dzienny zakres (w pipsach).
- ADR LVL: Pokazuje, czy obecny dzień wyczerpał swój ADR.
-
- NORM: Normalny zakres.
- ADR 1 / 2 / 3: Cena przebiła 1x, 2x lub 3x ponad normalną dzienną objętość (oczekuj wyczerpania/odwrócenia).
- RSI: 15-minutowy RSI do szybkiego wykrywania stanów wykupienia (czerwony) lub wyprzedania (zielony).
👁️ 3. WIZUALIZACJE WYKRESU I NARZĘDZIA SMC
1. Killzones (Pudełka płynności) Wskaźnik automatycznie rysuje przezroczyste pudełka dla sesji Azjatyckiej, Londyńskiej i Nowojorskiej. Rozmiar pudełka w pipsach jest oznaczony na dole.
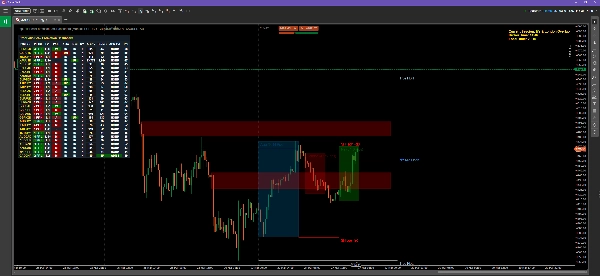
2. Linie polowania na stop loss (BTMM) Linie są rysowane 25 i 50 pipsów powyżej i poniżej pudełka sesji azjatyckiej. Są to instytucjonalne cele, gdzie market makerzy polują na stop lossy detalicznych traderów przed odwróceniem trendu.
3. Prawdziwe PDH i PDL Srebrne linie oznaczają Prawdziwe Poprzednie Maksimum Dnia oraz Poprzednie Minimum Dnia, obliczane ściśle od Prawdziwego Otwarcia Azji do Prawdziwego Zamknięcia Nowego Jorku (ignorując martwy wolumen rollover).
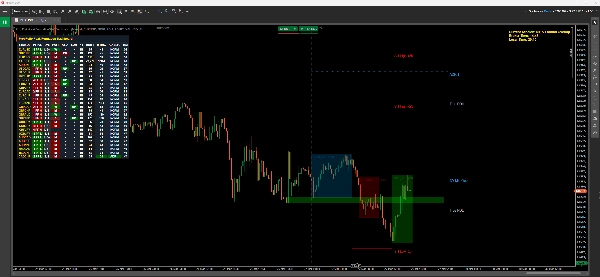
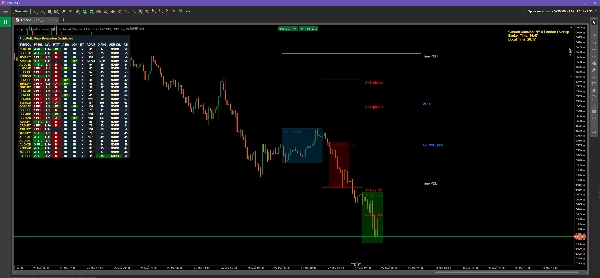
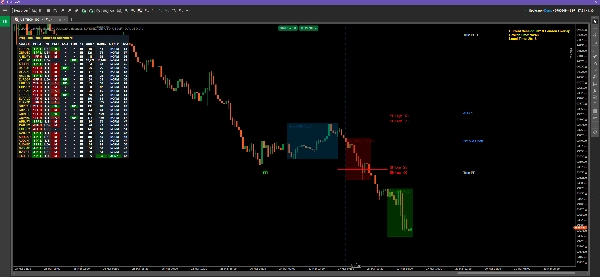
4. Podaż i Popyt (S&D) Silnik skanuje ostatnie 150 świec w poszukiwaniu instytucjonalnej nierównowagi.
- Czerwone pudełka: Niezałatwiona podaż (strefy sprzedaży).
- Zielone pudełka: Niezałatwiony popyt (strefy kupna).
- Uwaga: Strefy znikają, gdy cena całkowicie je zneutralizuje (przetestuje).
5. Linie celów ADR Na podstawie Peak Formation wskaźnik rysuje pomarańczowe lub niebieskie przerywane linie oznaczające cele wyczerpania 1x, 2x i 3x Średniego Dziennego Zakresu na dany dzień.
📈 4. VOLUME PROFILE (Elastyczny vs. Stały)
Wskaźnik posiada w pełni zintegrowany silnik Volume Profile do znalezienia Punktu Kontroli (POC) oraz Wartości Obszaru Wysokiego/Niskiego (VAH/VAL).
Jak używać trybu ELASTYCZNEGO:
- W ustawieniach wskaźnika upewnij się, że Tryb VP jest ustawiony na
Flexible. - Na wykresie pojawią się dwie pionowe przerywane linie w kolorze aqua.
- Po prostu kliknij i przeciągnij te linie, aby zaznaczyć dowolny zakres cenowy na wykresie.
- Histogram Volume Profile, POC i obszar wartości zostaną natychmiast obliczone i dopasowane do dokładnego obszaru między dwiema liniami!
Jak używać trybu STAŁEGO: Ustaw tryb na FixedDaily. Profil automatycznie obliczy wolumen dla bieżącego dnia handlowego bez potrzeby używania linii do przeciągania.
⚙️ 5. HUD CZASU I ALERTY
Zaawansowany HUD czasu W prawym górnym rogu zobaczysz złoty wyświetlacz tekstowy. Automatycznie oblicza czas twojego brokera, lokalny czas komputera i dokładnie informuje, która sesja handlowa jest obecnie aktywna (np. "Nakładanie się NY i Londynu").
Alerty terminala Gdy pojawi się nowa formacja szczytu, powiadomienie zostanie wydrukowane bezpośrednio w zakładce cTrader Automate -> Log, abyś nigdy nie przegapił setupu. Uwaga: Dla zaawansowanych zewnętrznych powiadomień push, odwiedź profil dewelopera Propfolio Solutions, aby dowiedzieć się o rozszerzonym pakiecie.
Podsumowanie
Opinie klientów
5 | 100 % | |
4 | 0 % | |
3 | 0 % | |
2 | 0 % | |
1 | 0 % |