
present
Zarejestruj się i otrzymaj 50 $ zniżki na pierwszy zakup
Trading product for Bias_Ctrader Wskaźnik Supertrend Imbalance, image 1
Bias_Ctrader
Wskaźnik
Wersja 1.0, Jun 2026
Windows, Mac
Trading product for Bias_Ctrader Wskaźnik Supertrend Imbalance, image 2
Trading product for Bias_Ctrader Wskaźnik Supertrend Imbalance, image 3
Trading product for Bias_Ctrader Wskaźnik Supertrend Imbalance, image 4
Od 10/03/2026
2
Sprzedaż

Opis

Czy masz trudności z określeniem właściwego kierunku rynku na początku swojej sesji? Daily Bias Candles & Levels Indicator całkowicie automatyzuje Twoją codzienną analizę.

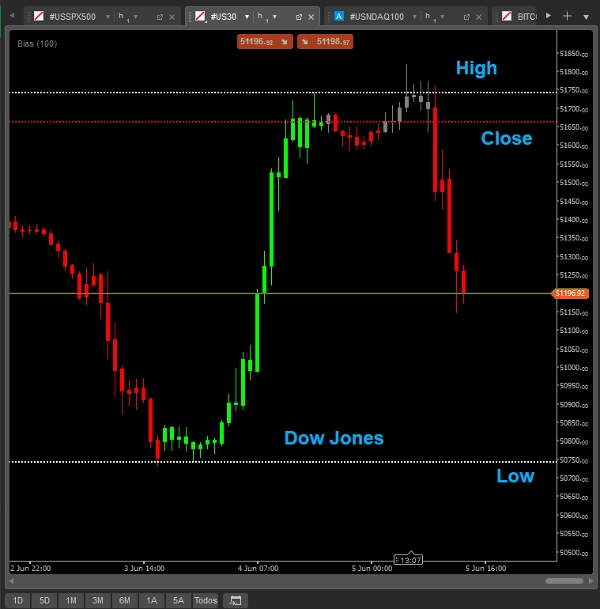
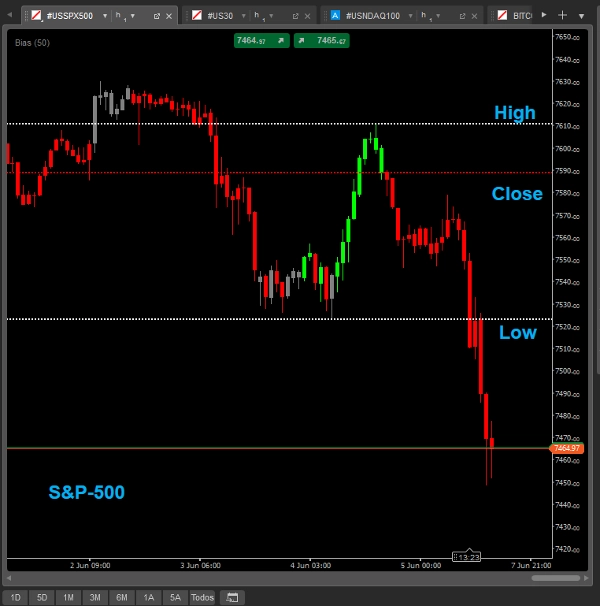
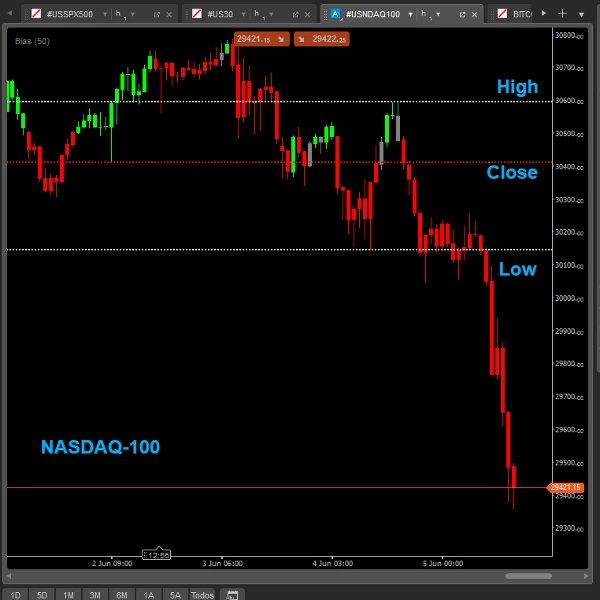
Algorytm matematycznie oblicza maksimum (High), minimum (Low) oraz cenę zamknięcia (Close) poprzedniej sesji dla dowolnego aktywa. Na podstawie tych kluczowych poziomów wskaźnik precyzyjnie określa, czy rynek znajduje się w strefie kontynuacji wzrostowej, kontynuacji spadkowej, fazie korekty lub fazie bocznej.

Aby nie tracić koncentracji podczas handlu, wskaźnik koloruje świece w czasie rzeczywistym. Natychmiast przypomina Ci, czy jesteś powyżej czy poniżej kluczowych poziomów, pozwalając na realizację strategii zgodnych z prawdziwym instytucjonalnym nastawieniem dnia.


Jak działa mapowanie stref i świec?

  • Strefy kontynuacji wzrostowej (Bullish Extension): Świece w niestandardowym kolorze, gdy cena przebija i utrzymuje się mocno powyżej poprzedniego maksimum. Czas na poszukiwanie ekspansji w górę!
  • Strefy kontynuacji spadkowej (Bearish Extension): Świece w niestandardowym kolorze, gdy cena notowana jest poniżej poprzedniego minimum. Idealne do podążania za masywnymi impulsami sprzedaży.
  • Fazy korekty / zakres boczny: Neutralne lub ostrzegawcze kolory, gdy cena jest uwięziona między poprzednim maksimum/minimum a ceną zamknięcia. Chroni Cię przed handlem w brudnych strefach akumulacji lub pułapkach rynkowych.


Optymalizuj swój plan tradingowy, unikaj handlu po niewłaściwej stronie rynku i podążaj za płynnością inteligentnych pieniędzy. Pobierz swoją wersję już dziś!

Podsumowanie

Podsumowanie AI
Bias_Ctrader is a trading indicator designed to automate daily market bias analysis by calculating the previous session's High, Low, and Close prices for any asset. It visually colors candles in real time based on these key levels to indicate market phases: bullish continuation when price breaks above the prior High, bearish continuation when price falls below the prior Low, and neutral or warning colors during retracement or sideways ranges between these levels. This color-coded system helps traders quickly identify whether the market is trending upward, downward, or consolidating, supporting alignment with institutional market bias. The indicator is applicable across various assets and integrates key concepts such as market structure, order blocks, supply and demand zones, and liquidity grabs. It provides visual cues directly on price charts to assist in decision-making without requiring manual calculation of prior session levels.
Profil wskaźnika
Kategoria wskaźnika
Trend
Typ wyjścia
Wizualizacja
Filtr
Wymagania dotyczące danych
Tylko słupki
Obsługiwane sygnały
Siła trendu
Odwrócenie trendu
Dotknięcie poziomu

Opinie klientów

0.0
Opinie: 0
Opinie klientów
Ten produkt nie ma jeszcze opinii. Wypróbowałeś(-aś) go już? Bądź pierwszy(-a) i powiedz o tym innym!

Dyskusja

Częste pytania

Supertrend
Imbalance
Order Block
Market Structure
Supply & Demand
Liquidity Grab
Support & Resistance
Produkty dostępne za pośrednictwem cTrader Store, w tym boty handlowe, wskaźniki i wtyczki, dostarczane są przez deweloperów zewnętrznych i udostępniane wyłącznie w celach informacyjnych oraz w celu zapewnienia dostępu technicznego. cTrader Store nie jest brokerem i nie zapewnia doradztwa inwestycyjnego, nie udziela spersonalizowanych rekomendacji ani nie gwarantuje przyszłych wyników.

Więcej od tego autora

Wskaźnik
EMA
Supertrend
+4
Dynamic dual MA cloud indicator. Identifies trends, crossovers, and pullback entries in real time for any asset.
Wskaźnik
Imbalance
AI-assisted
+4
Predict continuity or rejection on range bars. Plots a precise visual box to anticipate candle close price levels.

Możesz także polubić

Wskaźnik
RSI
Indicator Stochastic With RSI
Wskaźnik
Key Levels
Liquidity Grab
+2
A practical XAUUSD workspace for mapped levels, session context, liquidity events, alerts and risk planning.
Wskaźnik
ATR
RSI
+24
Daily moving averages, simplified. Displays 3 daily moving averages on lower timeframes with selectable MA types.
Wskaźnik
ATR
Key Levels
It combines the trend-filtering power of Renko charts with the volatility tracking of ATR Bands
Wskaźnik
ATR
Volume
+4
Advanced broker tick-volume profile with estimated POC, VAH/VAL, estimated HVN/LVN and session/lookback context.
Wskaźnik
Forex
Crypto
+2
Unique Pyramid Design , Clear Price Action Trend
Wskaźnik
ATR
MACD
+15
MACD Advanced -- It combines the standard MACD logic with a rich set of visual tools
Wskaźnik
ZLSMA: Zero-lag trend indicator! Catch trends fast with customizable settings. Boost your trading precision.
Wskaźnik
ATR
Volume
+5
Order blocks with measured hold-rate stats and confidence scoring — not just zones on a chart.
Wskaźnik
Volume
Order Block
+4
Advanced Pro Volume Profile: Double Back-to-Back, Institutional Dynamic, Fixed Range & Order Flow
Wskaźnik
ATR
Channel
Reversal Trap Probability Bands plots a dynamic volatility envelope around price & automatically detects "trap" reversal
Wskaźnik
Prop
Forex
+14
Automatically plots Fibonacci retracement levels using the highest and lowest points of a customizable time range
Logo „FBX VWAP”
Najwyżej oceniane
4.5
(4)
$19
Wskaźnik
Prop
VWAP
+12
FBX VWAP Anchored — Professional VWAP
Wskaźnik
The Break of Structure (BoSCHoCh) Indicator is a smart market structure tool designed to help traders easily spot trend.
Wskaźnik
[Hamster-Coder] Pivot Points (Multi Time Frame)
Wskaźnik
Supply & Demand
Support & Resistance
RAF Supply Demand Lite v1.0 automatically detects clean Supply and Demand zones using confirmed swing highs and lows. Zo
Wskaźnik
MACD
Crypto
A simple tool to control market sessions. fixed the display on the weekend.
Wskaźnik
SMC
Forex
+5
ICT liquidity engine for Gold: maps stop clusters, scores zones & projects the next target. Now with 4 ICT killzones.

Cena

Od 10/03/2026
2
Sprzedaż
















