Opis
Wyjaśnienie strategii podążania za trendem Forex (angielski)
Ta strategia podążania za trendem została zaprojektowana do identyfikacji silnych trendów rynkowych za pomocą wykładniczych średnich kroczących (EMA), MACD i ADX. Generuje sygnały kupna i sprzedaży na podstawie momentum i siły trendu.
Jak to działa
1️⃣ Identyfikacja kierunku trendu
- Szybka EMA (21) i wolna EMA (50) określają ogólny kierunek trendu:
-
- Trend wzrostowy → szybka EMA jest powyżej wolnej EMA
- Trend spadkowy → szybka EMA jest poniżej wolnej EMA
2️⃣ Pomiar momentum trendu (histogram MACD)
- Histogram MACD potwierdza momentum:
-
- Momentum wzrostowe → histogram MACD jest powyżej zera
- Momentum spadkowe → histogram MACD jest poniżej zera
3️⃣ Sprawdzanie siły trendu (wskaźnik ADX)
- ADX (14) mierzy siłę trendu:
-
- Silny trend → ADX jest powyżej 25
- Słaby trend → ADX jest poniżej 25 (brak sygnałów)
Realizacja transakcji
✅ Sygnał kupna (wejście wzrostowe)
- Szybka EMA > wolna EMA (trend wzrostowy)
- Histogram MACD > 0 (potwierdzenie momentum)
- ADX > 25 (silny trend)
- 🔹 Strzałka kupna pojawia się poniżej najniższej ceny
❌ Sygnał sprzedaży (wejście spadkowe)
- Szybka EMA < wolna EMA (trend spadkowy)
- Histogram MACD < 0 (potwierdzenie momentum)
- ADX > 25 (silny trend)
- 🔻 Strzałka sprzedaży pojawia się powyżej najwyższej ceny
Kluczowe cechy
✔ Unika słabych trendów dzięki ADX
✔ Filtruje fałszywe sygnały potwierdzeniem MACD
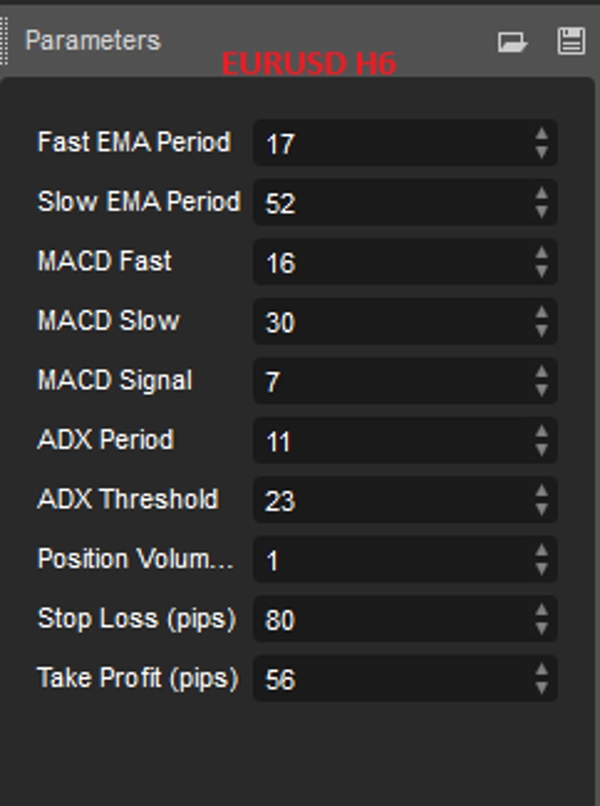
✔ Regulowane parametry dla lepszej personalizacji
Ten wskaźnik pomaga traderom podążać za silnymi trendami, unikając jednocześnie słabych warunków rynkowych. 🚀
Podsumowanie
Key components of the strategy include:
- Trend Direction: Determined by the relationship between a fast EMA (21) and a slow EMA (50). A bullish trend is indicated when the fast EMA is above the slow EMA; a bearish trend when it is below.
- Momentum Confirmation: The MACD histogram confirms momentum, with positive values indicating bullish momentum and negative values indicating bearish momentum.
- Trend Strength: The ADX (14) measures trend strength, with values above 25 signaling a strong trend suitable for trading; values below 25 indicate weak trends where no signals are generated.
Trade execution signals:
- Buy signals occur when the fast EMA is above the slow EMA, MACD histogram is positive, and ADX is above 25. A buy arrow appears below the low price.
- Sell signals occur when the fast EMA is below the slow EMA, MACD histogram is negative, and ADX is above 25. A sell arrow appears above the high price.
The bot features adjustable parameters for customization and aims to avoid weak trends and filter false signals, helping traders focus on strong market movements.
Dyskusja
Opinie klientów
5 | 0 % | |
4 | 100 % | |
3 | 0 % | |
2 | 0 % | |
1 | 0 % |