Penerangan
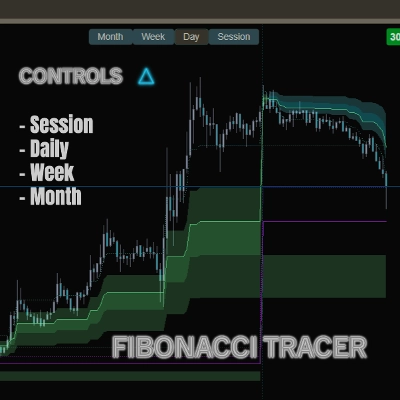
Penjejak Fibonacci secara automatik melukis dan mengemas kini tahap Fibonacci sementara meninggalkan jejak yang kelihatan tentang perkembangannya.
Ini membolehkan anda melihat bukan sahaja tahap statik, tetapi bagaimana Fibonacci berkembang bersama pasaran dari masa ke masa — sesuatu yang jauh lebih penting daripada garis yang terasing.
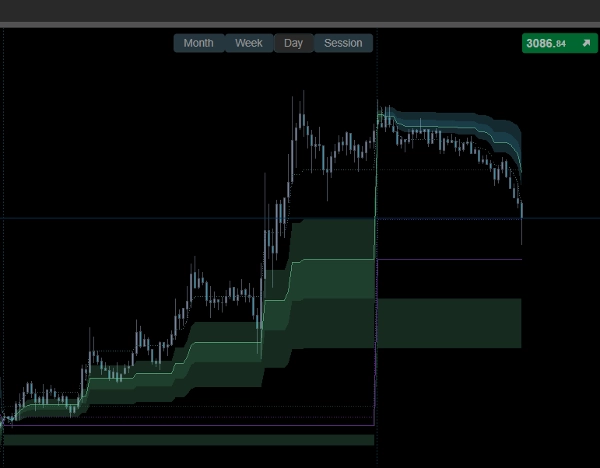
Butang kawalan pantas pada carta membolehkan anda bertukar dengan serta-merta antara Sesi, Harian, Mingguan, dan Bulanan pandangan, supaya anda boleh menjejaki bagaimana Fibonacci berkembang merentasi horizon masa yang berbeza.
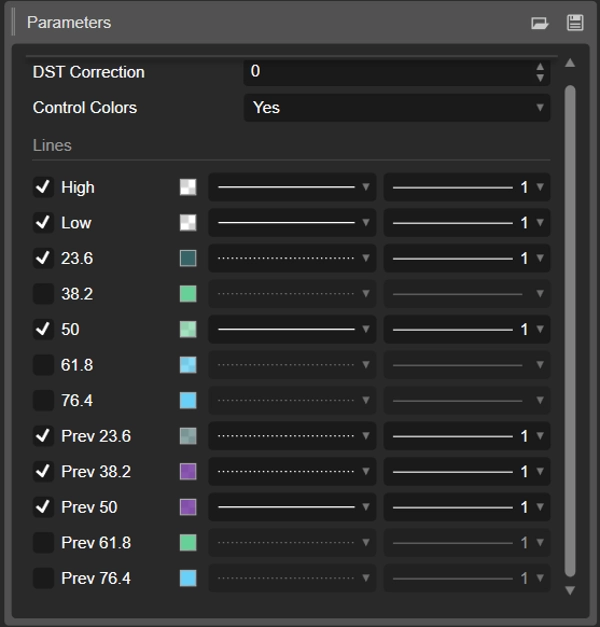
Selepas mengaktifkan penunjuk, buka tetapan dan nyahaktifkan kotak semak untuk garis-garis (seperti yang ditunjukkan dalam imej di bawah). Ini menghilangkan titik yang tidak diingini dan memberi anda skema lembut yang mesra mata seperti pada imej muka depan.
Kebanyakan penunjuk tidak mempunyai butiran penting — mereka mengabaikan peralihan pasaran — hujung minggu dan pertukaran malam, apabila kecairan diset semula kepada sifar — meneruskan pengiraan di mana set semula dan bacaan pasaran baru sebenarnya diperlukan; ini hanyalah serpihan kecil daripada pengalaman saya, tetapi memahaminya sudah boleh mengubah cara anda melihat pasaran.
Ringkasan
Ulasan pelanggan
5 | 50 % | |
4 | 50 % | |
3 | 0 % | |
2 | 0 % | |
1 | 0 % |


![Logo "Smart Money Concepts (SMC) [Iridio Capital]"](https://cdn.ctrader.com/image/webp/28b69fd1-ef54-4bed-9487-07e78e883be4_40934)
