ElliottWave
Indicator
106 downloads
Version 3.1, Jan 2026
Windows, Mac
"ElliottWave" uploaded image"ElliottWave" uploaded image"ElliottWave" uploaded image"ElliottWave" uploaded image"ElliottWave" uploaded image"ElliottWave" uploaded image"ElliottWave" uploaded image"ElliottWave" uploaded image"ElliottWave" uploaded image"ElliottWave" uploaded image
Since 23/07/2025
6.88M
Traded volume
27.52K
Pips won
528
Free installs

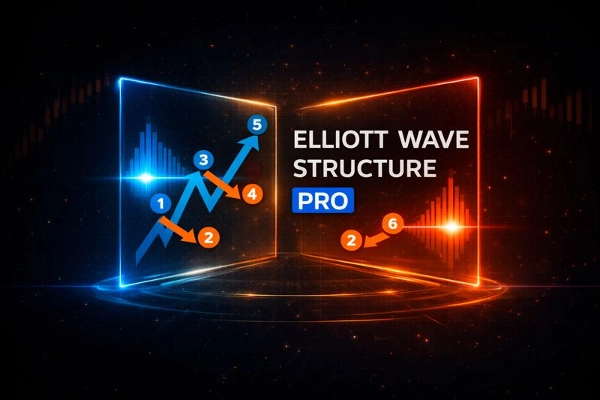
Elliott Wave-3 Continuation & Elliott Reversals


Elliott Wave Structure is an indicator designed to analyze market structure with the Elliott Wave theory.


It combines confirmed swing analysis, market structure, Elliott impulse detection, and a dedicated Wave-2 to Wave-3 continuation.

This tool was built for traders who require clarity, confirmation, and rule-based execution, not subjective drawing.


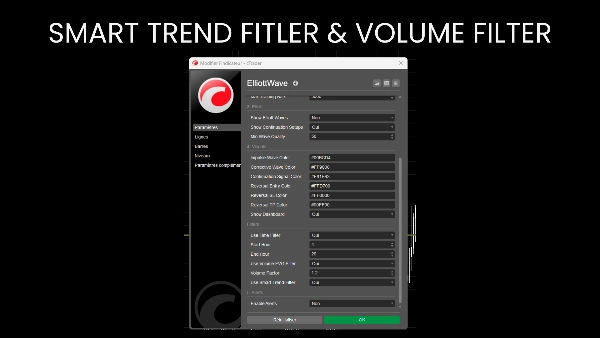
Non-Repainting Swing Engine

All calculations are based on confirmed swing points using:

  • Adjustable swing depth
  • Minimum price deviation (pip filter)
  • Confirmation bars

Once a swing is printed, it never moves, ensuring full historical reliability.


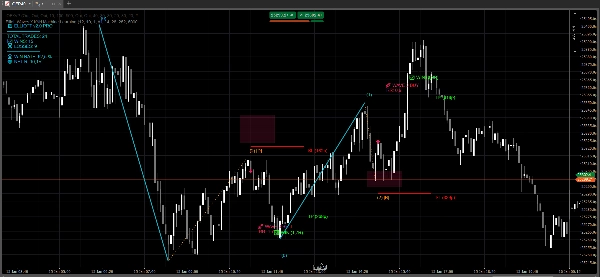
Market Structure Analysis:

Automatically identifies and labels:

  • Higher High (HH)
  • Higher Low (HL)
  • Lower High (LH)
  • Lower Low (LL)


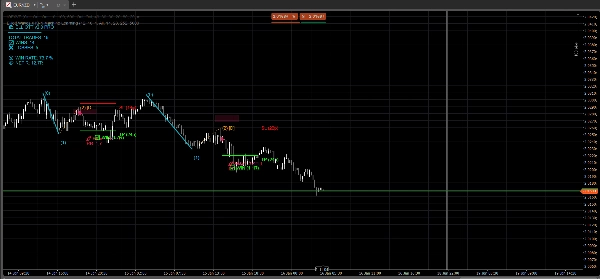
Elliott Wave Impulse Detection:

The indicator automatically detects complete 5-wave Elliott impulses in both directions:

  • Bullish: L-H-L-H-L-H
  • Bearish: H-L-H-L-H-L

It validates impulses using internal rules:

  • Wave 3 strength
  • Wave 2 and Wave 4 retracement logic
  • Wave 5 proportionality

Each impulse is graded using a quality score (0–100) and labeled directly on the chart.


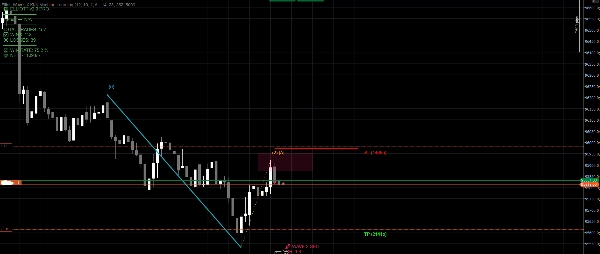
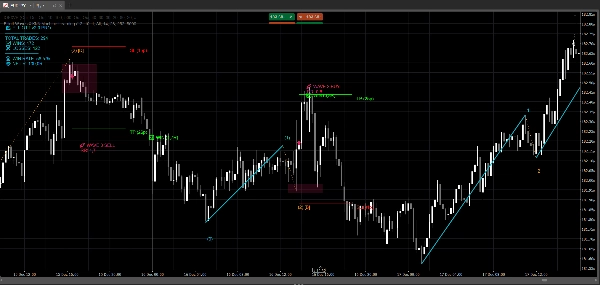
Wave-3 Continuation Setup (Primary Trading Module)

This is the core trading component of the indicator.

The system identifies Wave 0-1-2 continuation structures and prepares entries for Wave 3:

  • Bullish: Low → High → Higher Low
  • Bearish: High → Low → Lower High

Validation criteria include:

  • Wave 2 retracement between 23.6% and 88.6%
  • No invalidation through Wave 0
  • Trend alignment using market structure
  • Wave 1 strength relative to ATR
  • Price must be sitting on OB

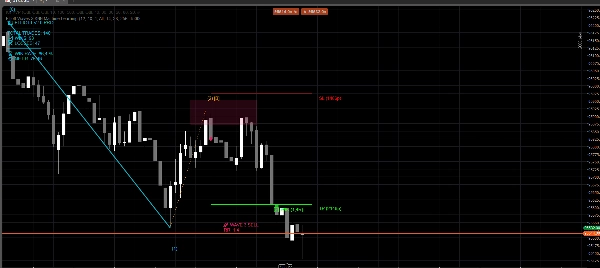
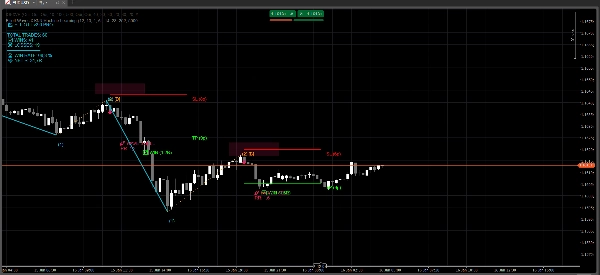
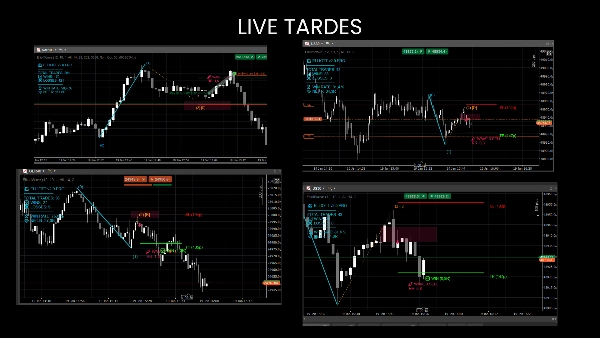
When validated, the indicator automatically draws:

  • Wave 1 and Wave 2 structure
  • OB entry zone
  • Entry signal
  • Stop Loss based on ATR beyond Wave 2
  • Take Profit based on ATR projection


Risk & Trade Management

  • Stop Loss and Take Profit are calculated dynamically using ATR
  • Risk-Reward ratio is displayed directly on the chart
  • Designed to avoid over-extended or low-quality setups


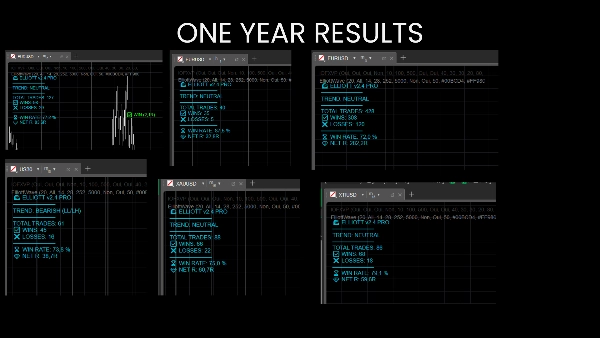
I personally use it for scalping indices on M1 & M5, but it does work with FX, commodities, stocks, etc... The dashboard shows if it has been profitable on a particular asset.


The free version let you try on major FX M15.

0.0
Reviews: 0
Customer reviews
No reviews for this product yet. Already tried it? Be the first to tell others!
Indices
Prop
Commodities
Stocks
Forex
Signal
Crypto
Scalping

More from this author

Indicator
Indices
Prop
Stocks
+3
UltimateFootprint
Ultimate Market Footprint: Price Action Zones (Gaps + Order Blocks + Signals)
Indicator
NZDUSD
Forex
EURUSD
+6
Currency Meter KNN
Stationary Strength Meter, Machine Learning kNN Reversion Signals
Indicator
Indices
Prop
Stocks
+3
Levels
Price Action Zone shows previous D/W/M key levels to help frame intraday price action, liquidity, and market structure.
Indicator
Indices
Commodities
Forex
+1
WolfeWaves
Automatic Wolfe Wave detection with full trade projection and performance dashboard for traders.
Indicator
Indices
Commodities
Stocks
+4
IOFXVP
POC Order Blocks Pro: Alpha-Scored IOF Zones

You may also like

Indicator
Indices
Commodities
Forex
+2
Advanced Swings
ICT Advanced Swings Indicator – Multi-Timeframe Precision
Fibonacci Pitchfan
Powerful all-in-one tool for traders seeking a clear, dynamic view of market structure. By merging pivots, trendlines &
Indicator
NAS100
NZDUSD
Breakout
+15
Professional-grade Anchored VWAP
It calculates Anchored VWAP and StdDev bands from a user-defined start date for cTrader charts.
Indicator
XAUUSD
Commodities
ATR
+1
[Stellar Strategies] Visual Trend Momentum
Visual Trend Momentum is a MA/ATR/Volume trend tool. Visual signals for strong trends & reversals. Customizable. 📈📉
Indicator
NAS100
NZDUSD
Breakout
+20
MAQuantAdaptivePriceZoneOscillator
MA Quant Adaptive Price Zone Oscillator identifie dynamiquement les zones de prix optimales pour les entrées et sorties.
Indicator
RSI
Breakout
XAUUSD
+4
ZScore Reversion
Z-Score: Measures price deviations from its mean. Spots overbought/sold (±2-3 SD) & reversals. Key for stats trading
Indicator
Grid
NAS100
NZDUSD
+15
SystemAlgo1
Institutional Supply & Demand Mapping Across Five Timeframes — Automatically.
Indicator
Forex
Supertrend
Signal
super ausama raid
Swing Flow is an advanced trend-following indicator that displays directly on the price chart
Indicator
NAS100
NZDUSD
XAUUSD
+10
VMM PriceRange Analyzer
Multi-timeframe ATR, smart swap calculator, range analysis all in one professional panel.
Indicator
NAS100
RSI
NZDUSD
+10
CVD Ai
"Advanced VSA & CVD indicator with 'A+ Setup' filtering based on Support & Resistance levels."
Breakout Mode Patterns
Brooks price action breakout mode patterns
VegaXLR - Auto Support and Resistance
cTrader Auto Support & Resistance detects key levels with Fibonacci analysis and sends real-time trading alerts.
Since 23/07/2025
6.88M
Traded volume
27.52K
Pips won
528
Free installs