
Description
WHAT IT DRAWS
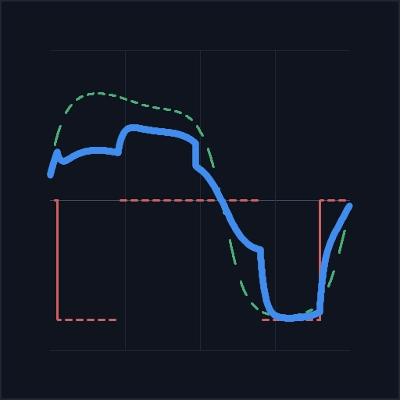
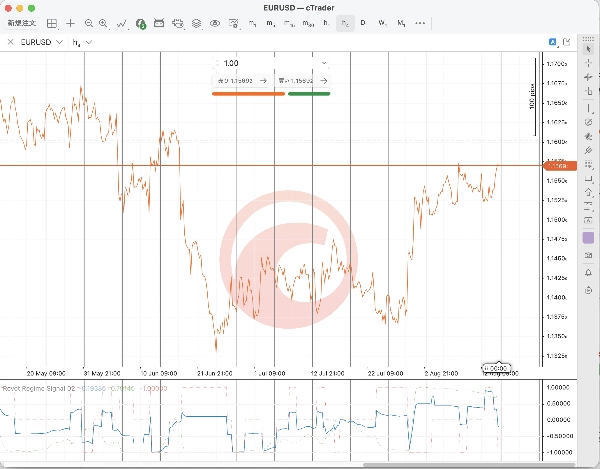
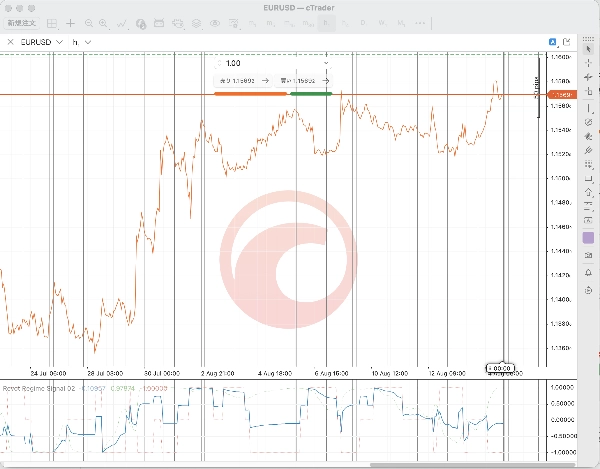
Three lines in a sub-panel below your chart.
Blended signal, blue and solid. The combined value, held between minus one and plus one.
Trend component, green and dotted. The trend half on its own.
Reversion component, red and dotted. The mean-reversion half on its own.
Seeing the two halves separately is the point. When they disagree, the blend sits near zero and you can see which side is pulling.
HOW IT IS COMPUTED
The trend half takes the ratio of a fast EMA to a slow EMA, minus one. That relative distance is standardised over its own history, bounded, and passed through tanh, so the line scales with how unusual the current separation is instead of flipping on every crossover.
The reversion half is a z-score of close over a fixed lookback. The state turns one way when the z-score reaches the entry level, the other way at the mirror level, and flattens once the z-score falls back inside the exit band. It holds its previous state in between, which is why the red line moves in steps rather than continuously.
The weighting compares short-window return volatility against long-window return volatility. When the short window runs hot relative to the long window, the blend leans towards the trend half. Otherwise it leans towards the reversion half. Follow the market when it is moving, fade it when it is quiet.
DECISION TIMING
Everything is computed on completed bars only. The forming bar is never drawn, so a value you have already seen does not change afterwards. The reversion state advances exactly once per closed bar, so a chart recalculation replays the same history rather than double-counting it.
WHAT IT DOES NOT DO
It places, modifies, cancels and closes no orders. It reads only the chart symbol's own bars. No network access, no file access, no external data feed.
It is a display. It does not forecast, and every trading decision stays yours.
PARAMETERS
The trend periods, the reversion lookback, the entry and exit levels, the two volatility windows and the weighting are fixed in this build. The line you see is one specific configuration rather than a surface you tune until it looks right.
SCOPE
This indicator was developed and checked on one instrument over one historical window. That says nothing about how it behaves on another symbol, another timeframe or another period. Run it on a demo account, on the instruments you actually trade, and decide for yourself whether the behaviour suits you.
Trading carries risk of loss.
SUPPORT
Questions answered within 3 business days. Version history published with every change.