Description
Trend Balance
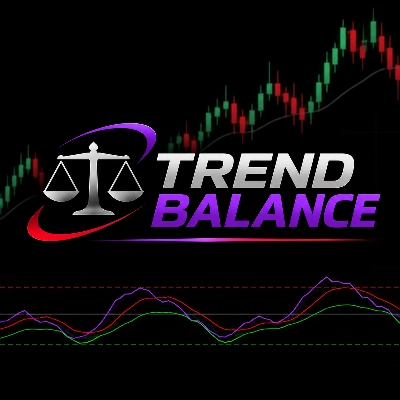
Trend Balance is a technical analysis indicator designed to evaluate market momentum and identify different market conditions through a combination of MACD and RSI concepts.
Its objective is to provide a clearer perspective on the balance between directional momentum and market consolidation, helping traders identify changes in market behavior.
Main Features
1. Overbought and Oversold Levels
Identifies areas of elevated positive and negative momentum, highlighting potential overbought and oversold market conditions.
2. Market Equilibrium
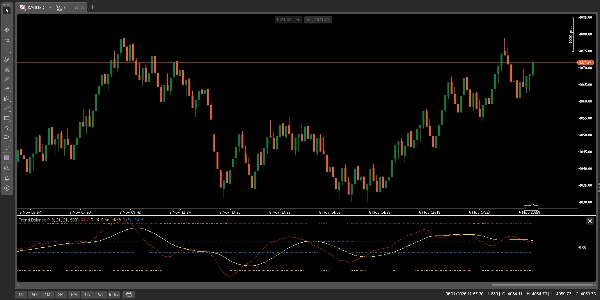
A region around the zero level represents a state of relative balance between market forces. When the indicator approaches this region, it can help identify periods of reduced directional momentum and potential market consolidation.
3. Dynamic Reference Levels
The indicator calculates reference levels based on historical momentum values, adapting its thresholds to the observed market behavior.
4. Market Condition Analysis
By combining momentum information with dynamic reference levels, Trend Balance provides a visual framework for evaluating market conditions and distinguishing stronger directional movements from periods of consolidation.
How to Use
Trend Balance can be used as a standalone analytical tool or as part of a broader trading strategy.
Traders can use its readings to evaluate market momentum, identify potential exhaustion zones, and recognize periods when the market may be lacking a clear direction.
The indicator can also be integrated into automated trading systems as an additional analytical component for market condition assessment.
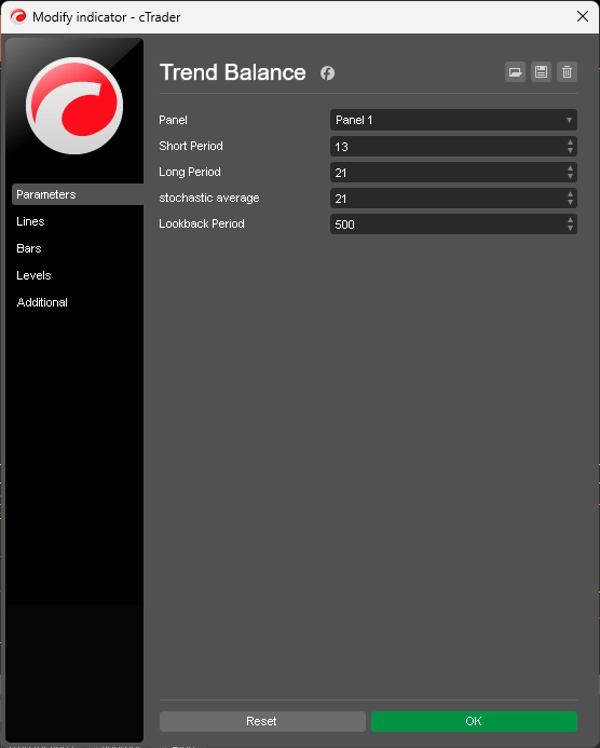
Trend Balance is primarily designed for use with Range and Renko charts. Its overbought and oversold levels are calculated dynamically based on historical indicator values (500 periods by default, configurable by the user). These chart types provide a more suitable representation of directional market movement, allowing the indicator to better identify momentum strength and equilibrium zones. On conventional time-based charts, extended periods of sideways movement can significantly influence the historical calculation, causing the reference levels to behave more like volatility entry and exit bands rather than meaningful representations of market strength.
Important Considerations
Trend Balance is an analytical tool, not an automatic trading system or a guarantee of trading results.
Overbought and oversold readings do not necessarily indicate an immediate reversal, just as values near zero do not guarantee that the market will remain sideways.
Its parameters should be adjusted according to the traded instrument, timeframe, and trading methodology.