Descrição
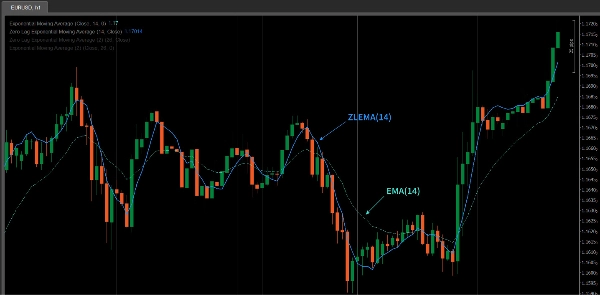
O ZLEMA (Média Móvel Exponencial de Atraso Zero) é uma versão avançada da Média Móvel Exponencial (EMA) projetada para reduzir o atraso comumente associado às EMAs tradicionais. Ao usar um método de cálculo especializado, o ZLEMA reage mais rapidamente às mudanças de preço, tornando-o especialmente eficaz em mercados voláteis.
A característica principal do ZLEMA é sua característica de "atraso zero", permitindo que ele acompanhe os movimentos de preço mais de perto, particularmente em condições de mercado de rápida movimentação. Comparado à EMA tradicional, o ZLEMA oferece tempos de resposta mais rápidos, tornando-o mais oportuno na captura de tendências de mercado.
ZLEMA vs EMA
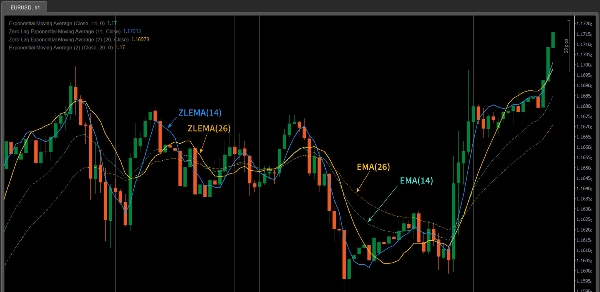
- Velocidade de Resposta: O ZLEMA reage mais rápido que a EMA tradicional. Ao compensar o atraso, ele acompanha as mudanças de preço de forma mais imediata.
- Efeito de Suavização: O ZLEMA mantém o efeito de suavização semelhante ao da EMA, enquanto minimiza o atraso do preço, tornando-o mais adequado para mercados de rápida movimentação.
- Caso de Uso: Se você está negociando em um mercado altamente volátil (como negociações de curto prazo ou intradiárias), o ZLEMA pode superar a EMA em termos de capacidade de resposta.
Características do Indicador ZLEMA
- Resposta de Atraso Zero: O ZLEMA reduz o atraso, permitindo que responda rapidamente às flutuações de preço do mercado, tornando-o mais preciso para capturar mudanças rápidas no mercado.
- Suavidade: Apesar de oferecer uma resposta mais rápida, o ZLEMA mantém o efeito de suavização da EMA, ajudando a evitar ruídos causados por flutuações de preço.
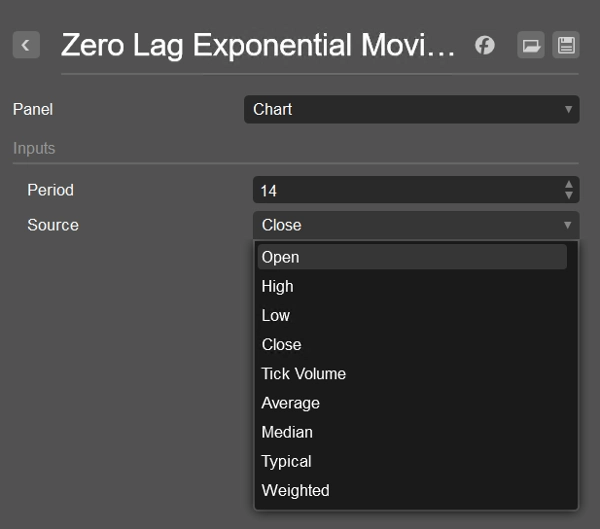
- Flexibilidade: O ZLEMA pode ser usado com diferentes fontes de dados de preço (como
Fechamento,Abertura,Alta, etc.), permitindo que os traders o ajustem com base nas necessidades de sua estratégia. - Confirmação de Sinal de Seguimento de Tendência e Reversão: O ZLEMA é ideal para identificar mudanças de tendência, especialmente em mercados voláteis, e confirmar sinais de reversão de preço.
Como Usar o Indicador ZLEMA
- Traders de Curto Prazo: O ZLEMA é perfeito para traders de curto prazo, pois pode responder rapidamente às flutuações de preço. Sua reação rápida o torna ideal para capturar reversões de tendência de curto prazo ou sinais de rompimento.
- Seguimento de Tendência: O ZLEMA também pode ser usado para acompanhar tendências de longo prazo, mas oferece mais sensibilidade que a EMA. Em uma tendência forte, o ZLEMA ajuda a identificar o início ou o fim das tendências mais rapidamente, auxiliando em ajustes oportunos da estratégia.
- Combinação com Outros Indicadores: O ZLEMA funciona bem quando combinado com outros indicadores técnicos, como RSI, MACD ou análise de padrões de preço para aumentar a precisão dos sinais. É especialmente útil quando combinado com indicadores de seguimento de tendência, como médias móveis, para confirmar rompimentos ou reversões de preço.
- Confirmação de Rompimentos e Reversões: O ZLEMA pode ajudar a confirmar rompimentos de preço a partir de níveis-chave ou sinais de reversão. Por exemplo, quando o preço cruza a linha do ZLEMA, isso pode indicar uma mudança de tendência, e vice-versa.
- Redução de Ruído: Devido ao seu atraso reduzido, o ZLEMA é melhor para filtrar o ruído que pode estar presente em médias móveis tradicionais, tornando-o uma ferramenta importante em negociações intradiárias ou mercados altamente voláteis.
Dicas para Usar o ZLEMA
- Ajuste o Período: Ajuste o período do ZLEMA com base no seu estilo de negociação e na volatilidade do mercado. Para negociações de curto prazo, use um período mais curto (por exemplo, 10 ou 14), enquanto para acompanhamento de tendências de longo prazo, um período mais longo (por exemplo, 50 ou 100) pode ser mais apropriado.
- Combine com Outras Ferramentas: Embora o ZLEMA ofereça excelentes capacidades de seguimento de tendência, combiná-lo com outros indicadores como RSI para condições de sobrecompra/sobrevenda ou MACD para força da tendência pode melhorar a precisão.
- Testes e Otimização: O desempenho do ZLEMA pode variar em diferentes condições de mercado. Recomenda-se realizar backtests e otimizá-lo cuidadosamente antes de usá-lo em negociações ao vivo para garantir os melhores resultados em sua estratégia.
Resumo
Key features include:
- Zero lag response for timely reaction to price fluctuations.
- Smoothness that filters out noise without sacrificing responsiveness.
- Flexibility to use various price data inputs such as Close, Open, or High prices.
- Utility in trend following and confirming reversal signals.
ZLEMA is particularly useful for short-term traders seeking to capture rapid trend reversals or breakouts, as well as for longer-term trend tracking with enhanced sensitivity compared to EMA. It can be combined with other indicators like RSI or MACD to improve signal accuracy and confirm price breakouts or reversals.
Users can adjust the indicator’s period to match their trading style and market conditions, optimizing performance through backtesting. ZLEMA helps reduce noise and lag, making it a valuable tool for intraday and volatile market trading.