Descrição
⚠️ Nós mudamos para 👉 PrimeQuant
🚫🚫🚫 Não compre este indicador!
Este OHLC PRO por LudwigICT é um ferramenta de sobreposição de gráfico multifuncional projetada para fornecer uma visualização profissional e rica em informações no seu gráfico cTrader.
Aqui está uma descrição do que ele faz:
🔹 Função Principal: Sobreposição OHLC
- Desenha barras OHLC personalizadas (Abertura, Máxima, Mínima, Fechamento) no seu gráfico.
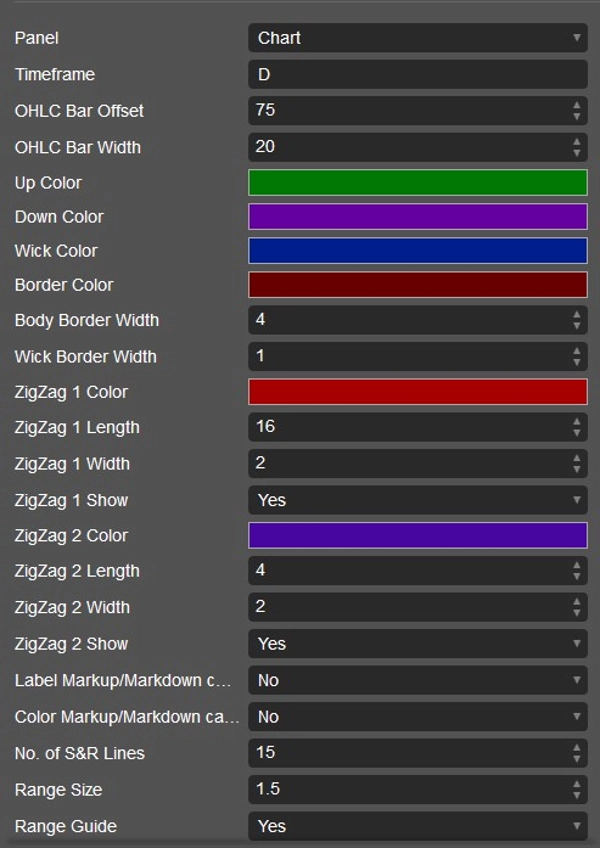
- Você pode definir:
-
- Qual timeframe OHLC usar (Diário, Semanal, Mensal ou intradiário como H1, M15, etc.).
- Deslocamento da barra (distância das velas atuais).
- Largura da barra, pavio, bordas e cores personalizadas.
- Efetivamente, você obtém “velas de referência” de timeframes superiores colocadas no seu gráfico atual.
🔹 Configuração Triple-M (Sinais de Alta/Baixa)
- Detecta um padrão de mínimas consecutivas mais altas (alta) ou máximas mais baixas (baixa).
- Quando detectado:
-
- Pode colocar ícones de triângulo (para cima ou para baixo) nas velas.
- Também pode recolorir as barras para mostrar mudança de momentum.
- Isso atua como um sinal de mudança na estrutura do momentum.
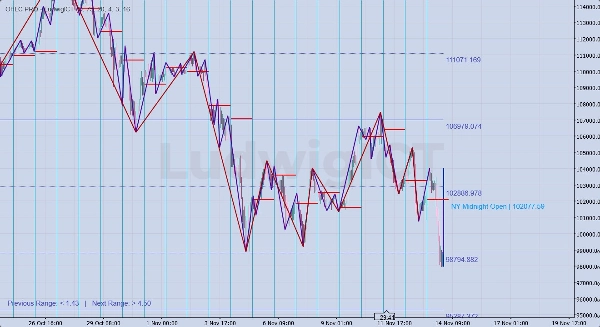
🔹 Ferramentas Duplas ZigZag
- Duas sobreposições ZigZag independentes:
-
- ZigZag #1 (comprimento maior, ex: estrutura de swing).
- ZigZag #2 (comprimento menor, ex: micro swings).
- Destaca oscilações de mercado para análise de estrutura, tendência e rompimento.
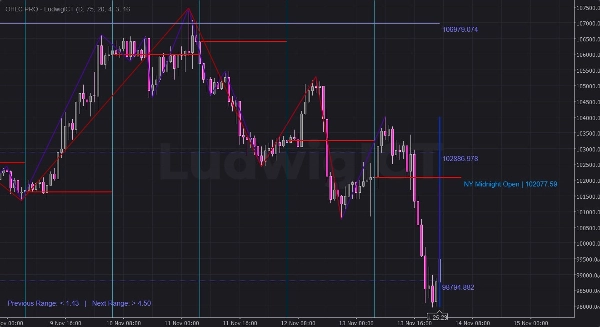
🔹 Suporte & Resistência Gann
- Usa uma tabela de números Gann + lógica ATR para calcular níveis de S/R.
- Traça múltiplas linhas de suporte/resistência acima e abaixo do preço.
- As linhas podem ser estilizadas (sólidas, pontilhadas, estendidas para a esquerda, etc.).
- Rotula os níveis com valores de preço.
- Também fornece Guias de Alcance:
-
- “Alcance Anterior” vs. “Próximo Alcance” relativo ao ATR.
- Ajuda a prever zonas de expansão ou contração.
🔹 Níveis da Meia-Noite de Nova York
- Detecta automaticamente o preço de abertura da meia-noite da sessão de Nova York.
- Desenha:
-
- Linha horizontal no preço de abertura da meia-noite de NY.
- Linha vertical no início da sessão.
- Rótulos mostrando “NY Midnight Open | preço”.
- Você pode estender essas linhas por 1 ou 2 dias, ou adicionar horas extras.
- Útil para trading estilo ICT (viés da sessão de Nova York, pontos de equilíbrio, etc.).
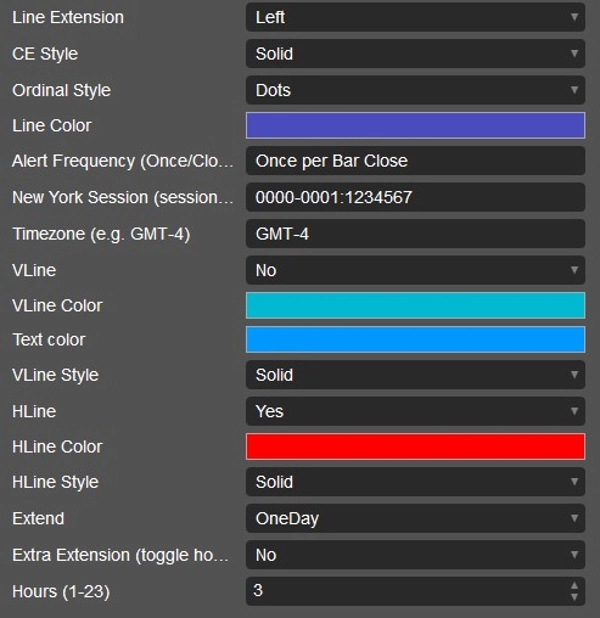
🔹 Personalização & Alertas
- Cada recurso tem parâmetros em menus suspensos:
-
- Cores, estilos, extensões de linha, número de linhas, etc.
- Alertas são suportados (embora principalmente via visuais no gráfico—o parâmetro de frequência de alerta está disponível).
- Remoção limpa ao fechar o indicador (para que seu gráfico não fique desordenado).
✅ Resumindo:
Este indicador é uma ferramenta multifuncional de price action. Ele combina:
- Velas OHLC de timeframes superiores
- Sinais de padrão de momentum (Triple-M)
- Duas estruturas ZigZag
- Níveis S/R Gann + guias de alcance
- Marcadores de abertura da meia-noite da sessão de Nova York
É feito para trading baseado em estrutura, sessão e níveis, especialmente útil para traders estilo ICT ou de price action.
Eu explico como você pode usá-lo praticamente ao negociar XAU/USD
🔹 Uso Prático no Trading (Ouro com OHLC PRO)
1. Sobreposição OHLC de Timeframe Superior
- Exemplo: Traçar OHLC Diário enquanto negocia em M5/M15.
- Você verá a vela de ontem “dentro” do seu gráfico intradiário.
- Uso:
-
- Preço se aproximando da máxima/mínima do dia anterior = área de caça à liquidez.
- Abertura/fechamento diário = filtro de viés (acima = alta, abaixo = baixa).
- Ajuda você a negociar dentro do intervalo diário.
👉 No ouro, a sessão de NY frequentemente ataca a máxima/mínima do dia anterior antes de reverter.
2. Sinais Triple-M
- O padrão Triple-M (série de mínimas ascendentes ou máximas descendentes) = momentum de curto prazo.
- Uso:
-
- Triple-M de alta próximo a suporte (mínima HTF ou abertura da meia-noite de NY) → possível scalp longo.
- Triple-M de baixa próximo a resistência (máxima HTF ou nível Gann) → possível scalp curto.
- Pode colorir barras para reconhecimento visual rápido em movimentos rápidos do ouro.
👉 Funciona bem para entradas de sniper em M1–M5 quando alinhado com o viés HTF.
3. Duplo ZigZag
- ZigZag #1 (comprimento maior) = estrutura de swing.
- ZigZag #2 (comprimento menor) = micro estrutura.
- Uso:
-
- Identificar quebras na estrutura do mercado (BOS/CHOCH).
- Negociar somente na direção do ZigZag maior (#1).
- Usar o ZigZag menor (#2) para confirmação de entrada.
👉 Exemplo: Viés diário de alta → esperar mudança do ZigZag #2 para alta próximo ao suporte HTF.
4. Suporte & Resistência Gann
- Gera uma grade de níveis matemáticos de S/R.
- Uso:
-
- Se o preço está consolidando, os níveis marcam prováveis pontos de rompimento de expansão.
- Combine com o guia de alcance ATR:
-
- "Alcance Anterior" pequeno → espere expansão de volatilidade.
- "Próximo Alcance" alto → nível forte de rompimento à frente.
👉 No ouro, os níveis Gann frequentemente se alinham com números redondos (ex: 2400, 2420, 2435).
5. Abertura da Meia-Noite de Nova York
- Esta é uma das ferramentas ICT mais poderosas para o ouro.
- Uso:
-
- Preço relativo à abertura da meia-noite de NY = viés direcional.
- Se o preço ficar acima da abertura da meia-noite → sessão NY em alta.
- Se abaixo → viés de baixa.
- Linha horizontal atua como referência de equilíbrio (50%).
- Observe varreduras de liquidez ao redor deste nível nas killzones de Londres/NY.
👉 Exemplo:
Abertura da meia-noite de NY = 2405.
- Se Londres derrubar o preço para 2398 e NY recuperar 2405 → configuração forte de compra.
🔑 Juntando Tudo (Exemplo de Configuração)
- Início da sessão NY:
-
- Traçar OHLC Diário.
- Anotar abertura da meia-noite de NY.
- Observar níveis Gann próximos.
- Esperar por captura de liquidez (ataque à máxima/mínima diária ou S/R Gann).
- Verificar Triple-M / ZigZag #2 para confirmação micro de alta/baixa.
- Entrar com stop atrás da varredura de liquidez.
- Alvo no lado oposto do intervalo ou próximo nível Gann/HTF.
✅ Resumindo:
- OHLC Diário + Meia-Noite NY = filtro de viés.
- ZigZag + Triple-M = timing de entrada.
- Gann + Guia de Alcance = alvos de lucro & sinais de expansão.
Este indicador basicamente oferece todas as ferramentas estilo ICT em um só pacote para XAU/USD.
Se você tiver alguma dúvida ou encontrar algum problema, sinta-se à vontade para me contatar. Ficarei feliz em ajudar você!
Aviso Legal:
Ao usar meus algoritmos, você reconhece que o trading envolve riscos inerentes e que o desempenho passado não garante resultados futuros. É essencial que você tenha uma estratégia sólida de gerenciamento de risco e, acima de tudo, que mantenha disciplina ao aderir aos níveis de stop-loss. A falha em gerenciar o risco adequadamente pode levar a perdas significativas. Não sou responsável por quaisquer resultados financeiros decorrentes do uso destes algoritmos. Negocie com responsabilidade e sempre siga práticas adequadas de gerenciamento de risco.
Fique abençoado! 🙌
Resumo
Avaliações de clientes
5 | 100 % | |
4 | 0 % | |
3 | 0 % | |
2 | 0 % | |
1 | 0 % |


