
Descrição
⚠️ Nós mudamos para 👉 PrimeQuant
🚫🚫🚫 Não compre este indicador!
⚡ VERSÃO DE PRÓXIMA GERAÇÃO DISPONÍVEL: Esta ferramenta clássica LudwigICT foi redesenhada, reestruturada e relançada sob nossa nova marca de desenvolvedor, PrimeQuant. A nova versão apresenta uma interface simplificada e propriedades atualizadas para as condições atuais do mercado. Obtenha a versão atualizada com um preço com desconto legado aqui:
👉 Detecção Automática de Ondas de Elliott + Fibonacci
👉 Detecção Automática de Ondas de Elliott + Fibonacci
👉 Detecção Automática de Ondas de Elliott + Fibonacci
(Por favor, note: a listagem LudwigICT permanece ativa para usuários legados, mas não receberá mais atualizações ou descontos ativos.)
📈 Onda de Elliott – Níveis de Fibonacci [LudwigICT]
🔥 Desbloqueie todo o poder da Teoria da Onda de Elliott combinada com retracements dinâmicos de Fibonacci – tudo automatizado para você dentro do cTrader!
Este indicador traz contagem de ondas profissional e zonas precisas de Fibonacci diretamente para seus gráficos, tornando a previsão de tendências e a execução de negociações mais fáceis do que nunca.
✨ Principais Recursos
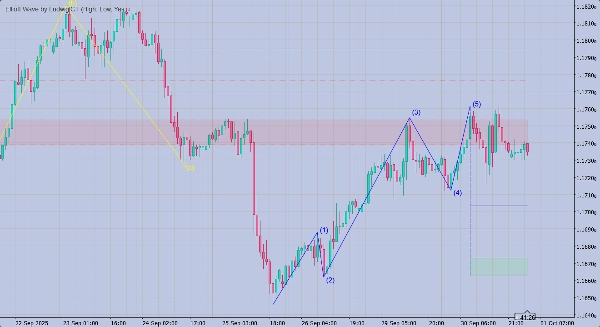
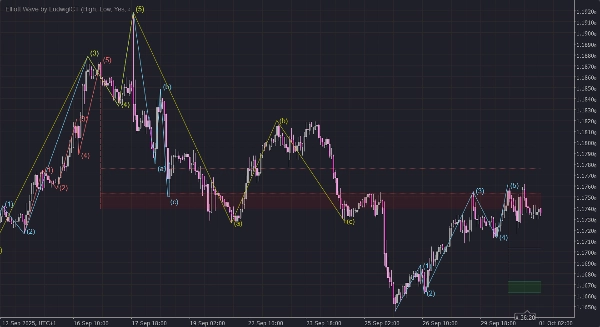
🔹 Detecção Automática de Ondas
- Identifica estruturas motivadoras de 5 ondas (1–5).
- Detecta padrões corretivos de 3 ondas (A–B–C) imediatamente após a conclusão da onda motivadora.
🔹 Retracements Dinâmicos de Fibonacci
- Plota automaticamente zonas-chave de retração: 0.500 • 0.618 • 0.764 • 0.854.
- Atualiza em tempo real com o desenvolvimento da onda.
- Destaca invalidações com linhas pontilhadas.
🔹 Estrutura Multi-ZigZag
- Executa três cálculos independentes de ZigZag com comprimento e cores personalizáveis.
- Garante sensibilidade flexível para diferentes condições de mercado.
🔹 Visuais Profissionais
- Rótulos de ondas limpos
(1)…(5)e(a)(b)(c)posicionados com deslocamentos inteligentes baseados em ATR. - Caixas de rompimento com marcadores X em negrito quando os níveis são ultrapassados.
- Áreas preenchidas com gradiente de Fibonacci para fácil visualização.
🔹 Assistência à Negociação
- Identificação automática de uma possível nova Onda (1) após correção A–B–C.
- Alertas sonoros para novas ondas, invalidações e sinais de rompimento.
🛠 Como Usar
- Aplicar ao Gráfico
-
- Simplesmente arraste e solte Onda de Elliott – Níveis de Fibonacci [LudwigICT] no seu gráfico cTrader.
- Funciona em todos os períodos (scalp, swing, longo prazo).
- Personalizar Parâmetros
- Leia as Ondas
-
- ✅ Ondas
(1–5)= Onda motivadora (direção da tendência). - 🔄 Ondas
(a–b–c)= Onda corretiva (contratendência). - 📊 Níveis de Fibonacci mostram prováveis zonas de retração para entradas/saídas.
- ✅ Ondas
- Negocie com Confiança
-
- Entre em negociações perto dos retracements de Fibonacci após uma onda motivadora concluída.
- Gerencie o risco quando os níveis forem rompidos (o indicador avisa automaticamente).
- Procure o ícone Próxima Onda (1) para antecipar novos ciclos de tendência.
🎯 Por Que Escolher Este Indicador?
✅ Economiza horas de contagem manual de ondas.
✅ Evita erros subjetivos na análise da Onda de Elliott.
✅ Visuais limpos, precisos e profissionais diretamente no seu gráfico.
✅ Criado e otimizado por LudwigICT, confiável em automação de trading.
🖥 Compatibilidade
- Plataforma: cTrader Desktop v5+
- Instrumentos: Funciona em Forex, Ações, Índices, Commodities, Cripto.
- Períodos: De scalping de 1m a análise swing semanal.
⚡️ Comece Agora
🚀 Adicione Onda de Elliott – Níveis de Fibonacci [LudwigICT] ao seu arsenal de trading hoje e eleve sua análise de gráficos ao próximo nível!
👉 Perfeito para traders que dependem de ação de preço, estrutura e retracements de Fibonacci para cronometrar suas entradas e saídas com precisão.
Se você tiver alguma dúvida ou encontrar algum problema, sinta-se à vontade para me contatar. Estou feliz em ajudar você!
Aviso Legal:
Ao usar meus algoritmos, você reconhece que o trading envolve riscos inerentes e que o desempenho passado não garante resultados futuros. É essencial que você tenha uma estratégia sólida de gerenciamento de risco e, acima de tudo, que permaneça disciplinado em aderir aos níveis de stop-loss. A falha em gerenciar o risco adequadamente pode levar a perdas significativas. Não sou responsável por quaisquer resultados financeiros decorrentes do uso destes algoritmos. Negocie com responsabilidade e sempre siga as práticas adequadas de gerenciamento de risco.
Fique abençoado! 🙌
Resumo
Avaliações de clientes
5 | 100 % | |
4 | 0 % | |
3 | 0 % | |
2 | 0 % | |
1 | 0 % |


