Descrição
Mapa de Calor de Liquidez - Análise Profissional de Pivot em Múltiplos Prazos
Transforme seu trading com visualização avançada de liquidez. Este poderoso indicador revela zonas de liquidez institucional ao analisar pontos pivot em 10 prazos diferentes simultaneamente, criando um mapa de calor dinâmico que mostra exatamente onde o dinheiro inteligente provavelmente está posicionado.
Como Funciona
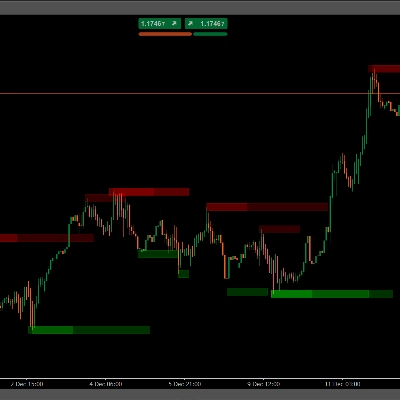
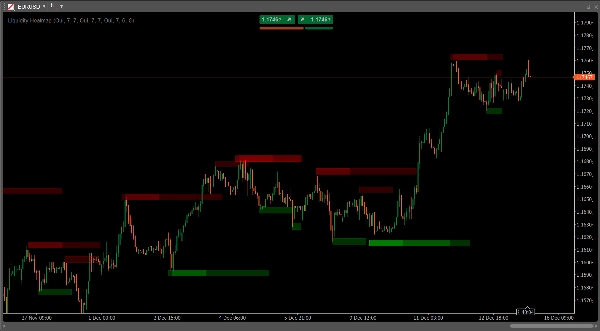
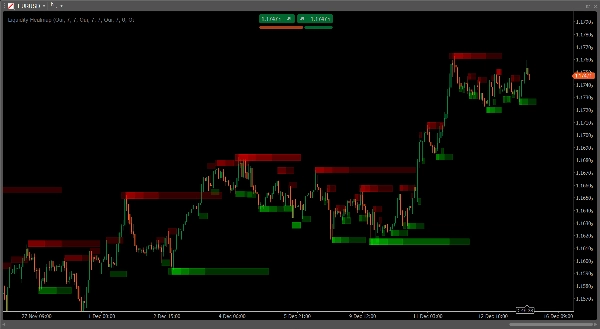
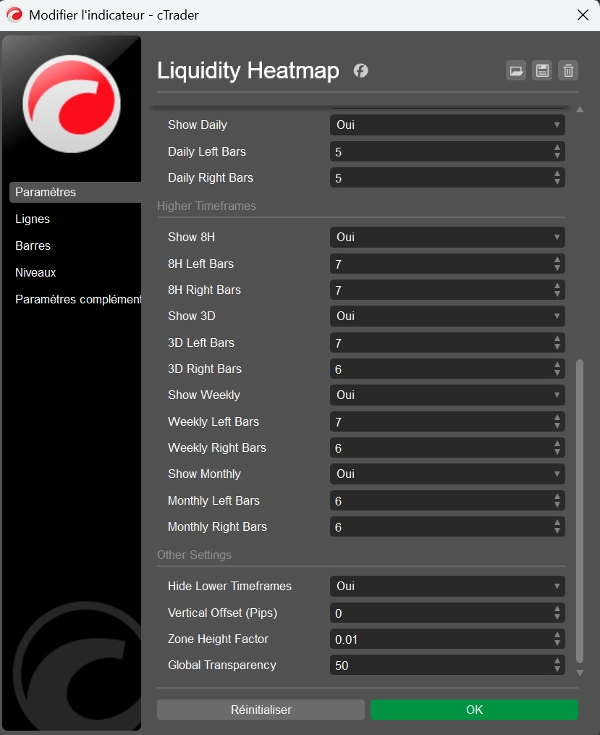
O indicador detecta máximas e mínimas pivot em múltiplos prazos (15min, 30min, 1H, 2H, 4H, Diário, 8H, 3D, Semanal, Mensal) e sobrepõe zonas semi-transparentes em cada nível pivot. Onde múltiplos pivots de diferentes prazos convergem, as zonas se acumulam e intensificam a cor, criando uma "assinatura térmica" que revela os níveis de liquidez mais fortes no seu gráfico.
Principais Características
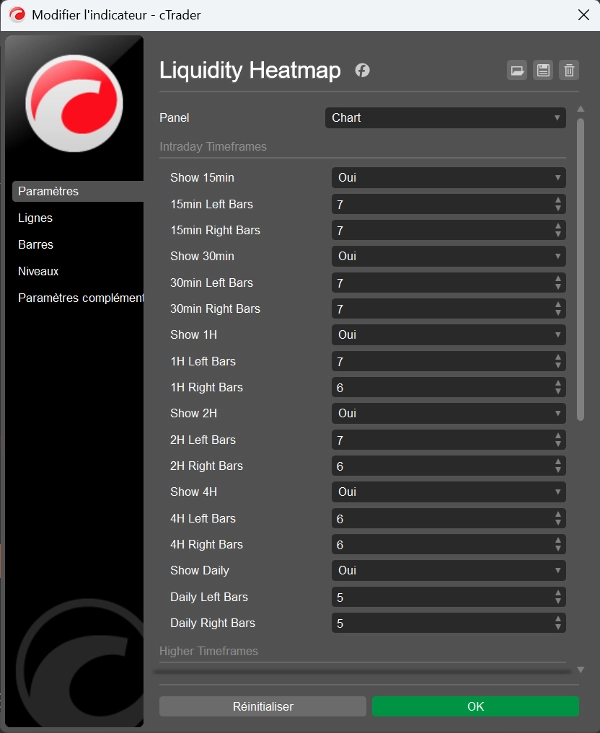
- 10 Prazos Personalizáveis: Analise simultaneamente desde intradiário (15min) até perspectivas de longo prazo (Mensal)
- Mapeamento Inteligente de Densidade: Zonas sobrepostas criam automaticamente áreas mais escuras mostrando confluência de liquidez
- Detecção de Pivot Totalmente Ajustável: Configure barras à esquerda/direita (2-20) para cada prazo independentemente
- Visualização Adaptativa: Altura da zona escala automaticamente com o zoom do gráfico para aparência consistente
- Zonas Ancoradas no Tempo: Zonas permanecem fixas no exato momento de formação, nunca se deslocando no seu gráfico
- Transparência Personalizável: Controle a transparência global (0-255) para adequar ao estilo do seu gráfico
- Filtragem Inteligente de Prazos: Opção para ocultar prazos menores com base na visualização atual do gráfico
- Controle de Deslocamento Vertical: Ajuste fino do posicionamento da zona com ajuste baseado em pips
- Codificação de Cores Separada: Zonas vermelhas para máximas pivot (resistência), verdes para mínimas pivot (suporte)
Perfeito Para
- Traders de Smart Money Concepts (SMC) identificando pools de liquidez
- Seguidores da metodologia ICT rastreando níveis institucionais
- Traders swing encontrando zonas de reversão de alta probabilidade
- Scalpers identificando capturas de liquidez intradiária
- Qualquer trader buscando confluência em múltiplos prazos
Aplicações de Trading
O mapa de calor revela onde os stop losses se concentram e onde provavelmente estão as ordens institucionais. Use essas zonas para:
- Antecipar varreduras de liquidez e reversões
- Identificar confluências fortes de suporte/resistência
- Encontrar pontos de entrada ótimos após capturas de liquidez
- Definir stop losses estratégicos além das principais zonas de liquidez
- Confirmar validade de rompimentos observando o consumo de liquidez
Por Que Este Indicador Se Destaca
Ao contrário dos indicadores pivot básicos que mostram níveis de um único prazo, este mapa de calor agrega dados de 10 prazos simultaneamente, oferecendo uma visão abrangente da estrutura do mercado. A visualização de densidade mostra instantaneamente quais níveis têm mais importância - quanto mais escura a zona, mais prazos concordam naquele nível de liquidez.
Otimizado para Performance
Processa eficientemente até 500 barras por prazo com gerenciamento inteligente de objetos, garantindo desempenho suave do gráfico mesmo com todos os prazos ativados.
Configuração Fácil
Instale e comece a negociar imediatamente com configurações padrão otimizadas, ou personalize cada parâmetro para combinar com sua estratégia e estilo de trading específicos.
Eleve sua análise de liquidez e negocie com a percepção do fluxo de ordens institucional. Perfeito para traders que entendem que o preço não se move aleatoriamente - ele se move para a liquidez.
Resumo
Key features include customizable pivot detection parameters for each timeframe, adaptive zone visualization that scales with chart zoom, and separate color coding for resistance (red) and support (green) zones. The indicator also offers adjustable transparency, vertical offset control, and smart timeframe filtering to hide lower timeframes based on the current chart view.
This tool is suitable for traders using Smart Money Concepts, ICT methodology, swing trading, scalping, or any strategy requiring multi-timeframe liquidity analysis. It helps identify clusters of stop losses and institutional orders to anticipate liquidity sweeps, reversals, strong support/resistance levels, optimal entry points, strategic stop losses, and breakout confirmations.
Liquidity Heatmap efficiently processes up to 500 bars per timeframe with optimized object management, ensuring smooth performance. It supports various markets including Forex, Crypto, Stocks, Indices, and Commodities. The indicator comes with optimized default settings and full customization options to fit different trading styles.
Avaliações de clientes
5 | 100 % | |
4 | 0 % | |
3 | 0 % | |
2 | 0 % | |
1 | 0 % |


