

Deskripsi
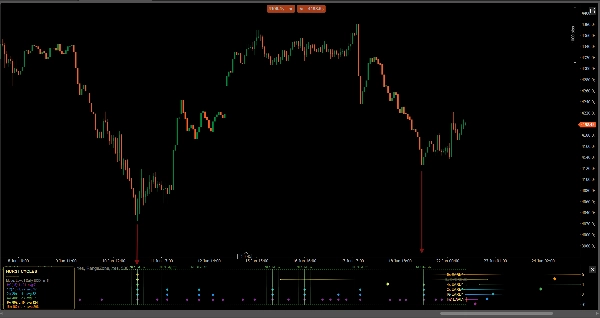
MTC Hurst Cycle Akademica memetakan struktur siklus dari setiap pasar, tingkat demi tingkat, dalam sub-pane khusus. Dibangun berdasarkan model pasar siklus J. M. Hurst, ini menandai palung siklus yang telah dikonfirmasi (dan opsional puncak) dari setiap tingkat siklus yang diaktifkan sebagai berlian berwarna, memproyeksikan waktu palung siklus berikutnya yang diharapkan, dan menyoroti "Nest of Lows" — batang di mana beberapa palung siklus diharapkan bertepatan, konteks pembalikan probabilitas tinggi klasik Hurst.
FITUR UTAMA
• 7 tingkat siklus bersarang (HC, 1C, 2x, 4x, 8x, 16x, 32x) — aktifkan kombinasi apa pun.
• Berlian hanya yang dikonfirmasi — penanda terbaru TIDAK dicat ulang pada batang langsung.
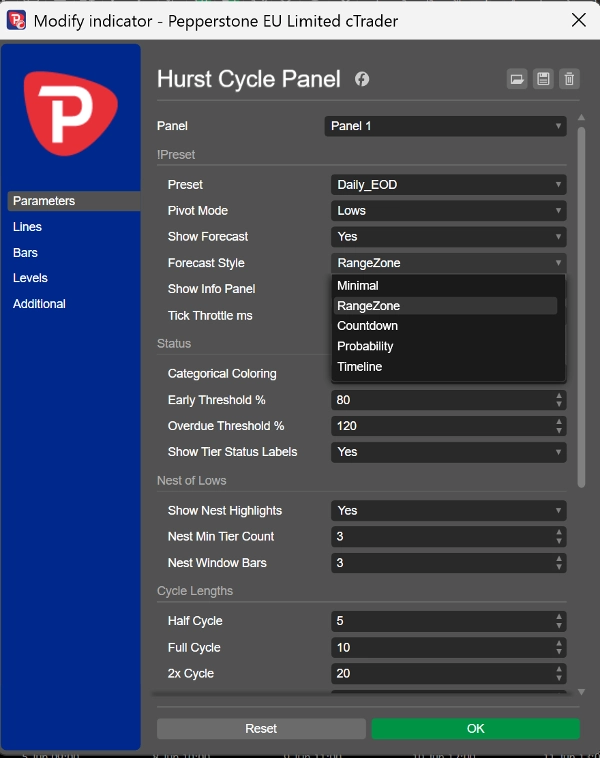
• Perkiraan palung berikutnya dalam 5 gaya tampilan: Minimal, Zona Rentang, Hitung Mundur, Probabilitas (1σ / 2σ), Garis Waktu.
• Penyorotan "Nest of Lows", diskalakan secara otomatis sesuai panjang siklus yang diaktifkan.
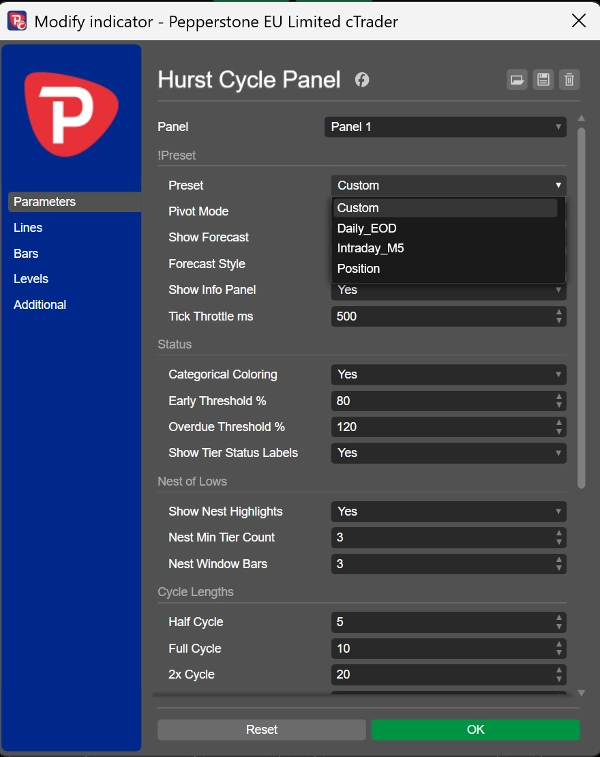
• Preset satu klik: Daily EOD, Intraday M5, Posisi — atau panjang siklus yang sepenuhnya kustom.
• Panel info modern di grafik: hitungan pivot per tingkat, panjang siklus rata-rata terukur (hanya ditampilkan saat bermakna secara statistik), dan pemeriksaan rasio harmonik.
• Mode pivot: Palung, Puncak atau Keduanya.
• Skala penyesuaian otomatis, rendering bersih dan bebas flicker.
CARA MENGGUNAKAN
Tambahkan di bawah grafik harga Anda. Bacalah berlian terendah dan sorotan "Nest" sebagai tulang punggung waktu siklus pasar, dan gunakan perkiraan untuk mengantisipasi jendela waktu pembalikan berikutnya. Ini secara alami dipasangkan dengan MTC Hurst FLD Akademica (level harga) dan MTC Hurst Pulse Akademica (osilator kematangan siklus).
BERFUNGSI PADA
Simbol apa pun dan kerangka waktu apa pun.
PENOLAKAN
Ini adalah alat analisis teknikal dan visualisasi berdasarkan teori pasar siklus J. M. Hurst. Ini tidak melakukan pemesanan dan tidak memberikan jaminan kinerja, akurasi, atau keuntungan. Analisis siklus bersifat probabilistik dan proyeksi ke depan adalah perkiraan, bukan prediksi. Selalu terapkan manajemen risiko dan penilaian Anda sendiri. Perilaku pasar masa lalu tidak menjamin hasil di masa depan.
Ringkasan
Key features include seven nested cycle tiers (HC, 1C, 2x, 4x, 8x, 16x, 32x) with customizable combinations, one-click presets for common timeframes (Daily EOD, Intraday M5, Position), and a modern on-chart info panel showing pivot counts, average cycle length, and harmonic-ratio checks. Users can select pivot modes (Lows, Highs, or Both) and benefit from auto-fitting scale and flicker-free rendering.
The panel works on any symbol and timeframe and is intended as a visualization tool to aid cycle timing analysis. It complements other Hurst-based tools for price levels and cycle maturity oscillation.




















