Descrizione
MTC INTERACTIV RAINBOW PRO
PERCHÉ QUESTO RAINBOW È DIVERSO
Gli indicatori Rainbow esistono da anni, bellissime bande di medie mobili sul grafico. Il problema: quasi nessuno sa davvero come leggerli o trasformarli in decisioni. Sembrano fantastici… e poi restano lì, inutilizzati.
MTC Interactiv Rainbow Pro risolve esattamente questo, in modo interattivo. Invece di fissare dozzine di linee colorate e indovinare, lavori CON l’arcobaleno: passa il mouse, clicca, concentra l’attenzione, misura e lascia che il grafico si spieghi da solo.
COS’HAI DAVANTI A TE
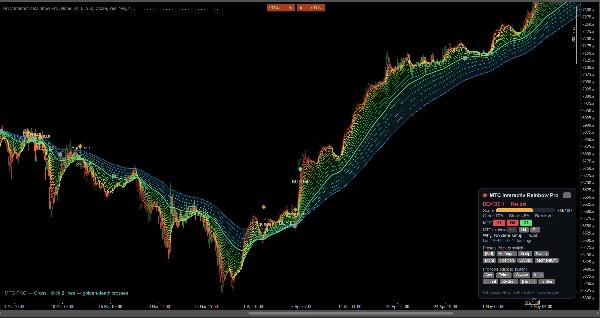
• Un arcobaleno EMA denso e fluido che mostra direzione del trend, forza e slancio in un colpo d’occhio.
• Indicatori chiari di BUY / SELL / EXIT e zone di compressione/rottura — tutto su barre chiuse, senza repaint.
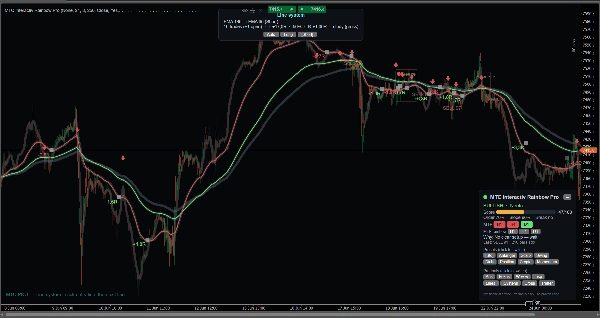
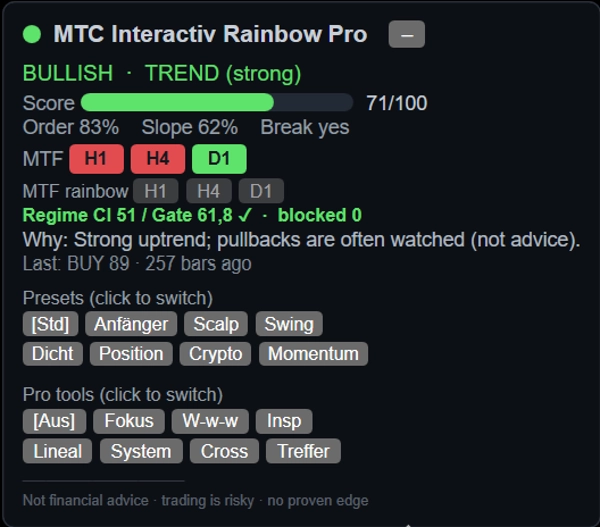
• Un cruscotto live compatto: direzione, punteggio di forza da 0 a 100, letture di ordine/pendenza/rottura, consenso multi-timeframe e un "perché" in linguaggio semplice.
COSA LO RENDE INTERATTIVO (la parte che nessun altro ti dà)
• Passa il mouse su qualsiasi linea per vedere istantaneamente il suo periodo EMA — finalmente sai quale media stai guardando.
• Focalizza una singola linea e attenua le altre per una visuale pulita.
• Strumenti "What-if" e Ispeziona per studiare qualsiasi barra o segnale passato.
• Un Righello integrato (ATR / R / pips).
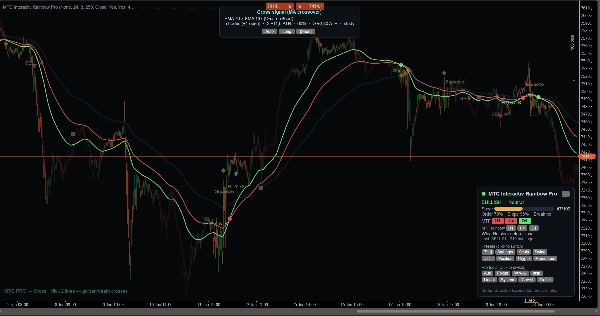
• Studi Line-System & Cross per esplorare come interagiscono due medie.
• Studio del tasso di rispetto: quanto spesso il prezzo rispetta effettivamente una linea scelta.
• Sovrapposizione Rainbow MTF con un clic: vedi l’arcobaleno H1 / H4 / D1 sul tuo grafico attuale in grigio.
• 8 preset con un clic (Principiante, Scalp, Swing, Posizione, Crypto, Momentum, Denso, Standard).
• Filtro regime opzionale e sovrapposizione per la gestione del trade (stop strutturale, banda di rischio 1R, linea trailing) per un pensiero disciplinato sul rischio.
COME LEGGERELO
A ventaglio e ordinato = trend forte. Compresso insieme = avvolgimento, una rottura è vicina. Freccia su/giù = segnale di rottura. Più densa e ordinata è la banda, più forte è il movimento. Un tutorial interattivo integrato (inglese & tedesco) ti guida passo dopo passo.
A CHI È RIVOLTO
• Principianti che hanno sempre voluto usare un rainbow ma non hanno mai saputo come — gli strumenti interattivi ti insegnano mentre procedi.
• Trader esperti che vogliono una lettura veloce e pulita di trend, momentum e contesto multi-timeframe.
• Costruttori di bot: una base di ricerca trasparente per le tue strategie e bot EMA / MA.
Funziona su qualsiasi simbolo e timeframe; gli strumenti interattivi brillano su M5–H4. Nessuna dimensione minima del conto — è uno strumento di analisi, non un autotrader.
IMPORTANTE — PER FAVORE LEGGI
Questo è uno strumento di analisi e apprendimento, NON un consiglio di investimento e non una garanzia di profitto. Tutti i segnali, punteggi e trade simulati sono osservazioni, non un vantaggio statisticamente provato. Il trading con leva è rischioso e può portare a perdite totali. Prendi sempre le tue decisioni e testa prima su un conto demo.
Riepilogo
Key features include an interactive interface allowing users to hover over lines to identify EMA periods, focus on individual lines, and use tools like "What-if" analysis, inspection of past signals, and a built-in ruler measuring ATR, price range, and pips. The indicator offers line-system and cross studies to analyze interactions between averages, a respect-rate study to assess price adherence to specific lines, and a one-click multi-timeframe rainbow overlay showing higher timeframe EMAs in grey.
A compact live dashboard provides a 0–100 strength score, order, slope, breakout readings, multi-timeframe consensus, and plain-language explanations. Eight one-click presets cater to various trading styles and markets, including scalp, swing, position, crypto, and momentum trading. Additional features include an optional regime filter and trade-management overlays for risk control.
Suitable for all symbols and timeframes, especially effective on M5 to H4 charts, this tool supports traders ranging from beginners learning to use EMA rainbows to experienced traders and bot developers seeking a transparent EMA research base.