
คำอธิบาย
Support & Resistance Toolkit เป็นตัวบ่งชี้วิเคราะห์โครงสร้างตลาดที่ครอบคลุมซึ่งออกแบบมาเพื่อช่วยเทรดเดอร์ระบุโซนแนวรับและแนวต้านที่มีความน่าจะเป็นสูงบนกราฟ โดยการรวมอัลกอริทึมตรวจจับจุดหมุนขั้นสูงหลายตัวเข้ากับโซนความผันผวนที่ปรับตัวได้ ตัวกรองการไหลของเงินสถาบัน และการวิเคราะห์สภาพคล่อง ชุดเครื่องมือนี้เปลี่ยนเส้นแนวรับและแนวต้านแบบดั้งเดิมให้กลายเป็นเครื่องมือกลยุทธ์ที่ขับเคลื่อนด้วยข้อมูล
การตรวจจับ
ชุดเครื่องมือนี้ประกอบด้วยวิธีการตรวจจับขั้นสูงสี่วิธีที่ออกแบบมาให้เหมาะกับสไตล์การเทรดและสภาพแวดล้อมตลาดที่แตกต่างกัน:
- Pivots: วิธีการตรวจจับแนวรับและแนวต้านแบบคลาสสิกโดยใช้ความแข็งแกร่งของการมองย้อนหลังทางซ้ายและขวาที่ปรับได้เพื่อค้นหาจุดสูงและต่ำในท้องถิ่น
- Donchian: อัลกอริทึมสถานะเครื่องจักรประสิทธิภาพสูงที่ตรวจจับโครงสร้างสวิงสลับกัน แทนที่จะใช้การหน่วงเวลาคงที่ มันยืนยันจุดสุดขีดเมื่อทิศทางตลาดเปลี่ยนแปลง
- CSID: วิธีการตรวจจับที่ขับเคลื่อนด้วยโมเมนตัมซึ่งระบุจุดเปลี่ยนโครงสร้างโดยอิงจากแท่งเทียนกระทิงหรือหมีติดต่อกัน เน้นโซนเริ่มต้นแนวโน้มที่แข็งแกร่ง
- ZigZag: อัลกอริทึมที่อิงความผันผวนซึ่งกรองความผันผวนของราคาขนาดเล็กโดยต้องการการเบี่ยงเบนขั้นต่ำเป็นเปอร์เซ็นต์ก่อนที่จะระบุสวิง
โซน / ระดับ
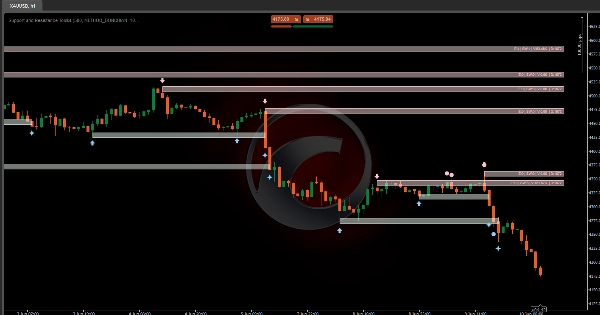
แตกต่างจากตัวบ่งชี้ทั่วไปที่เพียงแค่ลากเส้นคงที่ เครื่องมือนี้ถือว่าแนวรับและแนวต้านเป็นโซนราคาที่เปลี่ยนแปลงได้โดยอิงจากคุณสมบัติดังต่อไปนี้:
- ความลึกของโซน (ATR Mult): กำหนดความหนาของแต่ละโซนโดยอิงจากค่าเฉลี่ยช่วงจริง (Average True Range) ซึ่งช่วยให้โซนปรับขนาดโดยอัตโนมัติตามความผันผวนของตลาด
- บัฟเฟอร์เบรกเอาต์ (ATR Mult): บัฟเฟอร์ความปลอดภัยเฉพาะที่ขยายโซนออกไปเกินกว่าด้านเบรกเอาต์ ราคาต้องเคลื่อนที่เกินชั้นความผันผวนเพิ่มเติมนี้ก่อนที่ตัวบ่งชี้จะยืนยันการเบรกเอาต์ ช่วยลดสัญญาณเท็จและการหลอกลวง
การกรอง & การมองเห็น:
- รวมโซนที่ทับซ้อน: รวมโซนที่ตัดกันเป็น “Super Zone” ขนาดใหญ่ที่แสดงช่วงการโต้ตอบทางประวัติศาสตร์ทั้งหมด
- ซ่อนโซนเก่าที่สุดก่อน: ให้ความสำคัญกับโครงสร้างตลาดล่าสุดโดยซ่อนโซนเก่าเมื่อเกิดการทับซ้อน
- ซ่อนโซนใหม่ที่อายุน้อยที่สุดก่อน: รักษาโครงสร้างทางประวัติศาสตร์ที่ตั้งขึ้นโดยไม่สนใจโซนใหม่ขนาดเล็กที่ปรากฏภายในช่วงที่มีอยู่
การกรองระดับ ( E: การเข้า | S: ความแข็งแกร่ง | SW: การกวาด | V: ปริมาณ | D: ระยะเวลา )
- การเข้าในระดับราคา (E): ต้องการให้ระดับถูกทดสอบซ้ำจำนวนครั้งที่กำหนดก่อนที่จะปรากฏบนกราฟ
- การกวาด (SW): ตรวจจับกับดักสภาพคล่องที่ราคาละเมิดระดับชั่วคราวด้วยไส้เทียนแต่ปิดกลับภายในโซน
- ปริมาณการซื้อขาย (V): ติดตามปริมาณการซื้อขายรวมที่เกิดขึ้นขณะที่ราคามีปฏิสัมพันธ์กับโซน เน้นการมีส่วนร่วมของสถาบัน
- ระยะเวลา (D): ต้องการให้โซนอยู่รอดเป็นจำนวนแท่งขั้นต่ำก่อนที่จะถือว่าเป็นระดับโครงสร้างที่ถูกต้อง
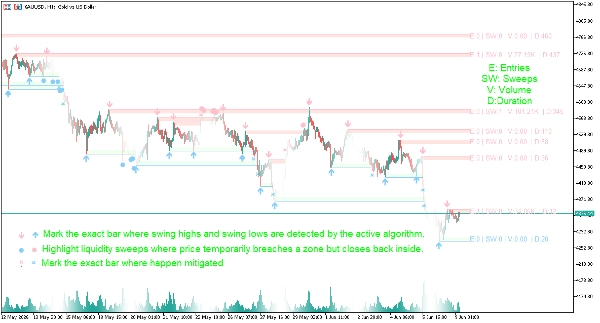
สัญญาณภาพ
- ⬆/⬇ ลูกศร: ทำเครื่องหมายแท่งเทียนที่แน่นอนที่ตรวจพบจุดสูงและต่ำของสวิงโดยอัลกอริทึมที่ใช้งานอยู่
- ● จุดใหญ่: เน้นการกวาดสภาพคล่องที่ราคาละเมิดโซนชั่วคราวแต่ปิดกลับภายใน
- ✖ กากบาท: ทำเครื่องหมายแท่งเทียนที่แน่นอนที่จุดสูงและต่ำของสวิงถูกย้าย
- ป้ายสรุป: แต่ละพื้นที่แสดงมีป้ายข้อมูลสั้น ๆ รวมถึงพารามิเตอร์ E (การเข้า), S (ความแข็งแกร่ง), SW (การกวาด), V (ปริมาณ) และ D (ระยะเวลา) ช่วยให้ผู้ใช้ประเมินคุณภาพโครงสร้างได้อย่างรวดเร็ว
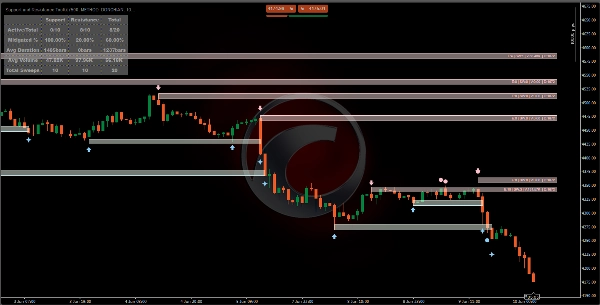
แดชบอร์ด
- ใช้งาน / รวม: แสดงจำนวนโครงสร้างที่กำลังใช้งานเทียบกับจำนวนทั้งหมดที่ตรวจพบในอดีต
- เปอร์เซ็นต์การบรรเทา: วัดความถี่ที่ระดับถูกทำลายหรือบรรเทา ให้ข้อมูลเชิงลึกเกี่ยวกับความน่าเชื่อถือของโครงสร้างตลาด
- ระยะเวลาเฉลี่ย: จำนวนแท่งเฉลี่ยที่โซนแนวรับหรือแนวต้านอยู่รอดก่อนถูกทำลาย
- ปริมาณเฉลี่ย: แสดงการมีส่วนร่วมของสถาบันเฉลี่ยภายในโซนก่อนเกิดเบรกเอาต์
- จำนวนการกวาดทั้งหมด: ติดตามพฤติกรรมการล่าสภาพคล่องทั่วตลาด
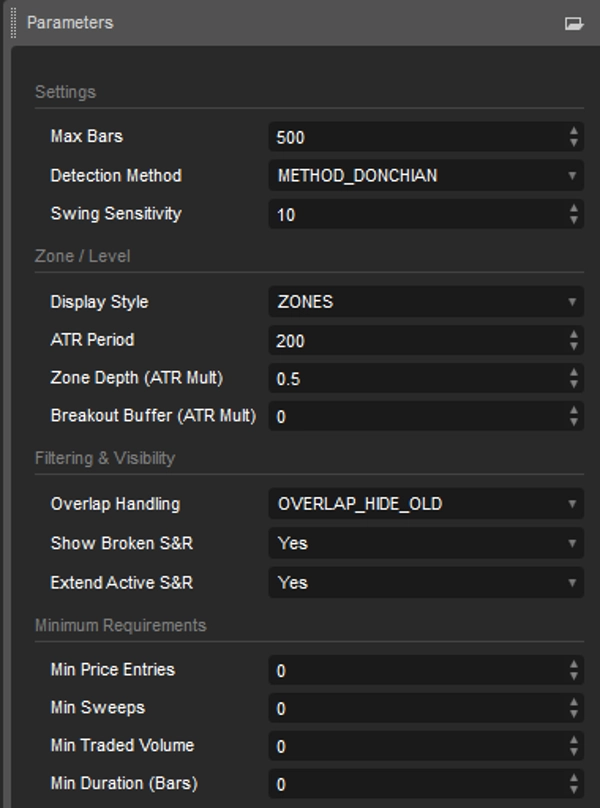
การตั้งค่าตัวบ่งชี้
การตั้งค่าการตรวจจับ
- วิธีการตรวจจับ: เลือกระหว่างตรรกะการตรวจจับสวิง Pivots, Donchian, CSID หรือ ZigZag
- ความไวของสวิง: ปรับการเบี่ยงเบนที่ต้องการหรือความยาวการมองย้อนหลังที่จำเป็นเพื่อยืนยันจุดสูงและต่ำของสวิง
การกำหนดค่าโซน & ระดับ
- สไตล์การแสดงผล: สลับระหว่างเส้นแนวรับและแนวต้านแนวนอนที่แม่นยำหรือโซนที่อิง ATR
- ช่วงเวลา ATR: กำหนดช่วงเวลาความผันผวนที่ใช้สำหรับการคำนวณโซน
- ความลึกของโซน (ATR Mult): ปรับความหนาของโซนแนวรับและแนวต้าน
- บัฟเฟอร์เบรกเอาต์ (ATR Mult): เพิ่มบัฟเฟอร์ความผันผวนเพื่อกรองเบรกเอาต์เท็จ
การมองเห็นกราฟ & การควบคุมโครงสร้าง
- การจัดการการทับซ้อน: เลือกวิธีจัดการโซนที่ทับซ้อนกัน (รวม, ซ่อนเก่าที่สุด หรือ ซ่อนใหม่ที่อายุน้อยที่สุด)
- จำนวนสูงสุดที่ใช้งาน (ไม่บรรเทา): จำกัดจำนวนโซนแนวรับและแนวต้านที่แสดงบนกราฟ
- แสดงแนวรับ & แนวต้านที่ถูกทำลาย: สลับการแสดงระดับที่ถูกทำลายเพื่อการวิเคราะห์ทางประวัติศาสตร์
- ขยายแนวรับ & แนวต้านที่ใช้งาน: ฉายระดับที่ใช้งานไปยังแท่งราคาที่จะมาถึง
ข้อกำหนดโครงสร้างขั้นต่ำ
- จำนวนการเข้าในระดับขั้นต่ำ: กำหนดจำนวนครั้งที่ต้องทดสอบซ้ำก่อนที่ระดับจะปรากฏ
- จำนวนการกวาดขั้นต่ำ: ต้องการจำนวนการกวาดสภาพคล่องก่อนแสดงโซน
- ปริมาณการซื้อขายขั้นต่ำ: รับรองว่าโซนตรงตามเกณฑ์การมีส่วนร่วมของสถาบันขั้นต่ำ
- ระยะเวลาขั้นต่ำ (แท่ง): ต้องการให้ระดับมีอยู่เป็นจำนวนแท่งที่กำหนดก่อนที่จะปรากฏ
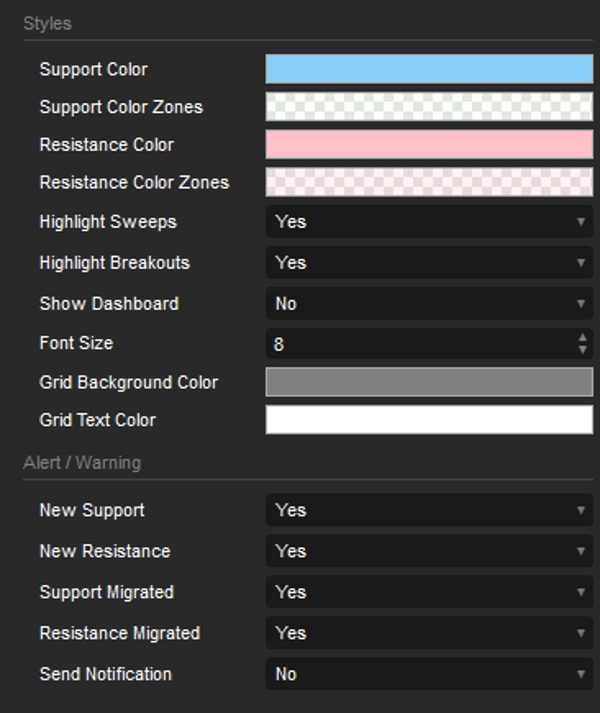
สไตล์และการแจ้งเตือน
- สไตล์: ปรับการกำหนดค่าสีของวัตถุ ซ่อน/แสดงแดชบอร์ด
- แจ้งเตือน: เปิด/ปิดการแจ้งเตือนเมื่อมีการตรวจพบ S&R ใหม่หรือมีการย้าย S&R
สรุป
Unlike traditional fixed lines, this tool defines support and resistance as dynamic price zones, with thickness and breakout buffers scaled by Average True Range (ATR) to adapt to market volatility. It features zone merging and selective visibility options to manage overlapping zones, prioritizing recent or historical structures as needed.
The indicator applies multiple filters based on price re-tests, liquidity sweeps, traded volume, and zone duration to validate structural levels. Visual signals include arrows marking swing points, dots highlighting liquidity sweeps, crosses for migrated swings, and summary labels displaying entries, strength, sweeps, volume, and duration metrics.
A dashboard provides real-time statistics on active versus total structures, mitigation percentages, average zone duration, volume, and liquidity sweep counts. Users can customize detection methods, sensitivity, zone display styles, ATR parameters, overlap handling, and structural requirements. Alerts can be enabled for new or migrated support and resistance levels.
This toolkit supports detailed market structure analysis with data-driven, volatility-adjusted zones to assist traders in identifying key price areas.


