

PnL Calendar Plus
Plugin para desktop
Versão 1.0, Sep 2026
Windows, Mac

Desde 27/02/2026
33.16K
Volume negociado
25.96K
Pips ganhos
10
Vendas
505
Instalações gratuitas
Descrição
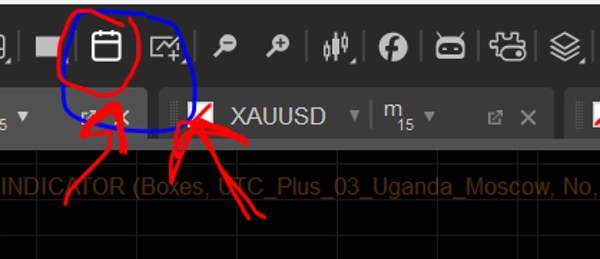
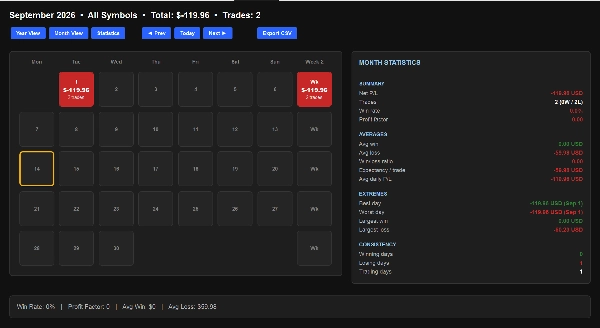
📅 Visualização do Calendário PnL
- Mapas de Calor Mensais e Anuais: Veja ganhos ou perdas diárias e mensais com blocos codificados por cores para lucro (verde) e perda (vermelho).
- Resumos Semanais: Acompanha o PnL total semanal e a contagem de negociações no final de cada linha.
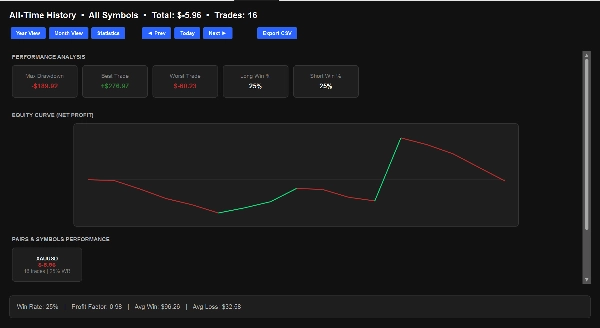
📊 Painel Abrangente de Estatísticas
- Métricas de Desempenho: Veja seu fator de lucro total, taxa geral de vitórias, valores médios de ganhos/perdas e máxima queda.
- Gráfico da Curva de Capital: Gráfico visual que acompanha a progressão do seu lucro líquido total ao longo do tempo.
- Detalhamento por Símbolo: Veja desempenho, taxas de vitória e total de negociações divididos por pares de moedas ou instrumentos específicos.
- Análise Temporal: Identifica automaticamente seus dias de negociação mais lucrativos e os meses de melhor desempenho.
🔒 Seguro e Leve
- Nenhuma Permissão Especial: Funciona com direitos de acesso padrão (
AccessRights.None), tornando-o completamente seguro e fácil de carregar no cTrader.
Resumo
Resumo de IA
PnL Calendar Plus is a cTrader plugin designed to visualize and analyze trading performance through a calendar-based interface and detailed statistics. It features monthly and yearly heatmaps that display daily and monthly profits or losses using color-coded tiles (green for profit, red for loss). Weekly summaries provide total profit and loss (PnL) and trade counts for each week.
The plugin includes a comprehensive statistics dashboard offering key performance metrics such as total profit factor, overall win rate, average win and loss amounts, and maximum drawdown. An equity curve chart tracks net profit progression over time. Users can view a symbol breakdown showing performance, win rates, and trade counts by specific currency pairs or instruments. Time analysis automatically identifies the most profitable trading days and months.
PnL Calendar Plus operates with standard access rights, requiring no special permissions, ensuring safe and lightweight integration within the cTrader platform. It supports historical data analysis and is categorized under trade journaling and chart UI tools.
The plugin includes a comprehensive statistics dashboard offering key performance metrics such as total profit factor, overall win rate, average win and loss amounts, and maximum drawdown. An equity curve chart tracks net profit progression over time. Users can view a symbol breakdown showing performance, win rates, and trade counts by specific currency pairs or instruments. Time analysis automatically identifies the most profitable trading days and months.
PnL Calendar Plus operates with standard access rights, requiring no special permissions, ensuring safe and lightweight integration within the cTrader platform. It supports historical data analysis and is categorized under trade journaling and chart UI tools.
Perfil do plugin
Categoria do plugin
Diário
Acesso aos dados
Histórico
Avaliações de clientes
0.0
Avaliações: 0
Avaliações de clientes
Ainda não há avaliações para este produto. Já o experimentou? Seja o primeiro a contar a outras pessoas!
Conversa
Perguntas frequentes
AI Integration
Chart UI Tools
Trade Journal
Os produtos disponíveis através da cTrader Store, incluindo bots de negociação, indicadores e plugins, são fornecidos por programadores terceiros e são disponibilizados apenas para fins informativos e de acesso técnico. A cTrader Store não é um corretor e não fornece aconselhamento em matéria de investimento, recomendações pessoais ou qualquer garantia de desempenho no futuro.
Mais deste autor









Preço
Desde 27/02/2026
33.16K
Volume negociado
25.96K
Pips ganhos
10
Vendas
505
Instalações gratuitas