説明
クラスタリングインジケーター
概要
クラスタリングインジケーターは、市場データのパターン、トレンド、異常を識別するのに役立つ強力なツールです。類似したデータポイントをクラスタにグループ化することで、このインジケーターは情報に基づいた取引判断に役立つ貴重な洞察を提供します。
特徴
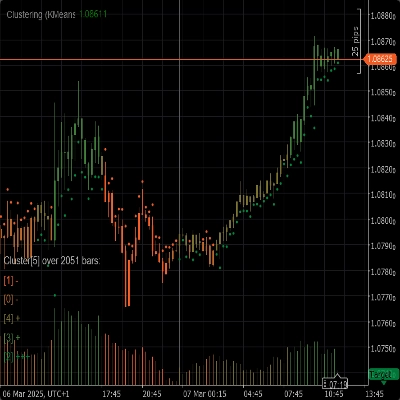
- クラスタリングアルゴリズム: K-Meansやガウス混合モデル(GMM)などの高度なクラスタリングアルゴリズムを利用して、市場データを効果的にセグメント化します。
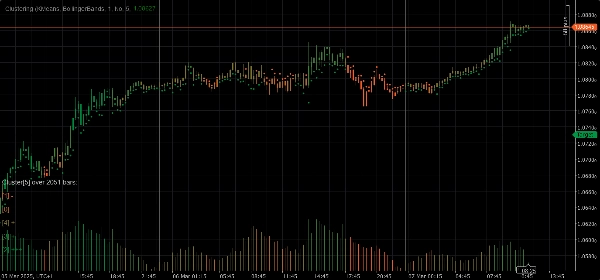
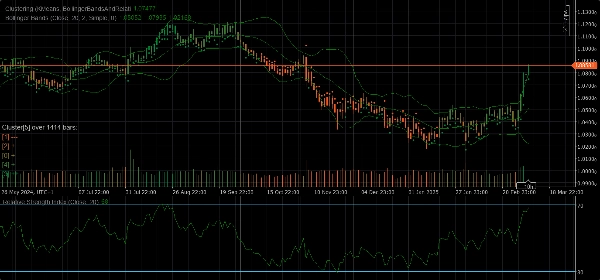
- 特徴セット: 生価格、ボリンジャーバンド、相対力指数(RSI)、ストキャスティクスオシレーター、ボリンジャーバンドとRSIの組み合わせなど、さまざまな特徴セットを提供し、市場の異なる側面を捉えます。
- 動的クラスタリング: クラスタ数を自動的に最適化し、クラスタリングの精度を最大化します。
- 可視化: チャート上でクラスタの動きやボラティリティを明確に視覚化します。
パラメーター
- クラスタリングアルゴリズム: 取引戦略に最適なK-Meansまたはガウス混合モデル(GMM)を選択します。
- 特徴セット: 生価格、ボリンジャーバンド、RSI、ストキャスティクスオシレーター、ボリンジャーバンドとRSI、または様々な指標を含む完全な市場データセットから選択します。
- ウィンドウ: 各データポイントに考慮するバーの数を定義します。
- 自動K: データに基づいてクラスタ数を自動的に決定します。
- 初期K: 自動Kが無効の場合の初期クラスタ数を設定します。
- 最大履歴バー数: クラスタリングに使用する履歴バーの最大数を制限します。0に設定すると、利用可能なすべてのバーが使用されます。
- クラスタによる色分け: 実際のクラスタ割り当てに基づいてチャートの色を再設定するかどうかを切り替えます。
- インサイト表示: 各クラスタの詳細な洞察をチャート上に表示します。
- インジケーター表示: 特徴セットで使用されるインジケーターを表示します。
自動適応パラメーター
- 自動適応: 指定された条件に基づいてインジケーターがクラスタを再初期化できる自動適応モードを有効または無効にします。
- 自動適応時間: 自動適応が発生可能な1日の時間(0-23)を指定します。
- 自動適応期間: 最後の適応から次の適応までに経過しなければならない最小時間数を指定します。
特徴セットパラメーター
ボリンジャーバンドパラメーター
- 期間: ボリンジャーバンドの計算に使用する期間。
- 偏差: ボリンジャーバンドの標準偏差の倍率。
- 移動平均タイプ: ボリンジャーバンド計算に使用される移動平均の種類(単純、指数など)。
相対力指数(RSI)パラメーター
- 期間: RSIの計算に使用する期間。
ストキャスティクスオシレーターのパラメーター
- 期間: ストキャスティクスオシレーターのK期間。
- Kスローイング: ストキャスティクスオシレーターのKスローイング係数。
- D期間: ストキャスティクスオシレーターのD期間。
- 移動平均タイプ: ストキャスティクスオシレーター計算に使用される移動平均の種類(単純、指数など)。
- 計算タイプ: ストキャスティクスオシレーターの計算タイプ(LowHigh、CloseCloseなど)。
使用方法
1. クラスタリングインジケーターをチャートに追加します。
2. 取引戦略に応じてパラメーターを設定します。
3. チャート上のクラスタとその動きを分析します。
4. インジケーターが提供する洞察を活用して、情報に基づいた取引判断を行います。
概要
カスタマーレビュー
5 | 50 % | |
4 | 50 % | |
3 | 0 % | |
2 | 0 % | |
1 | 0 % |


