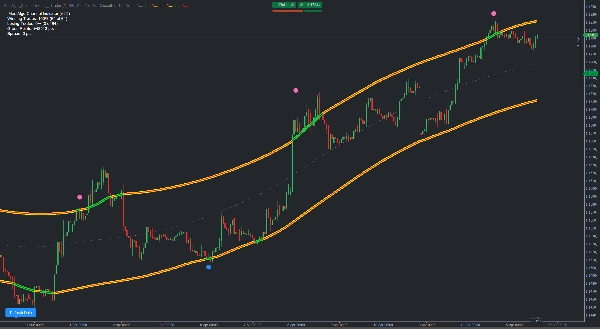
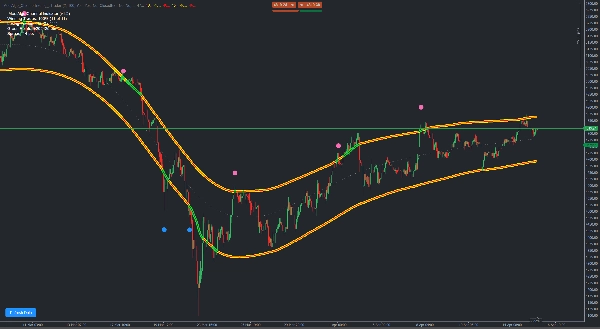
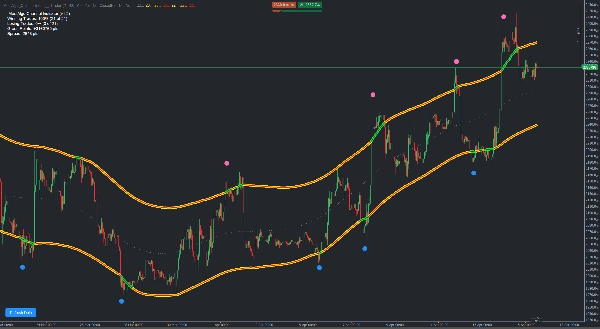
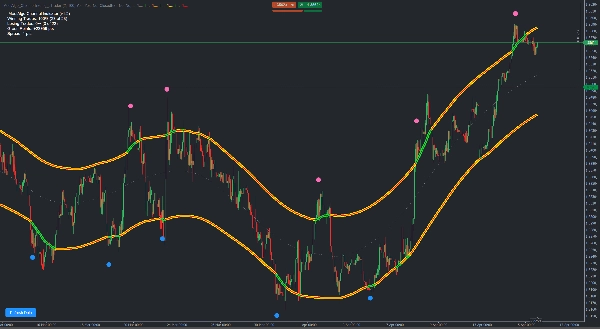
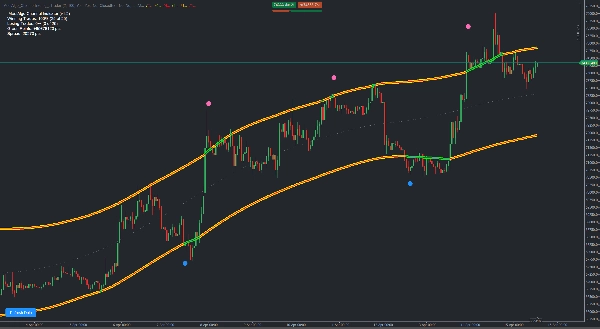
Логотип продукта "MeetAlgo_ChannelTrading_cTrader"
MeetAlgo_ChannelTrading_cTrader
5.0
03/09/2025
80
Desktop

MeetAlgo Channel Trading is a volatility-based indicator built using envelope theory. The indicator plots dynamic upper and lower bands based on recent price movement and statistical deviation. These bands aim to represent expected price boundaries, and values plotted outside the range may signal a shift in volatility.

The channel is designed to reflect general market behavior by identifying price areas that are relatively high or low. When price approaches or exceeds the upper or lower bands, a directional arrow is plotted to suggest potential reversal zones. These signals can be interpreted in combination with other forms of analysis.

The band width adapts to changing volatility, providing flexibility during different market conditions. The core method reduces lag by using a custom smoothing formula based on average price range.


Parameters Configurations

  • Deviations: Adjusts the sensitivity of the bands to volatility.
  • Minimum Bar Redraw: Sets the number of bars required before recalculating the channel.
  • Show Analysis Report: Displays historical signal-based outcome statistics.

Notifications

  • Signal Bar: Select whether calculations are based on live or closed bars.
  • Pop-Up Alerts: Displays message alerts on the platform.
  • Email Alerts: Sends email messages (requires setup in the platform).
  • Push Alerts: Sends mobile alerts (requires platform configuration).
  • Sound Alerts: Plays audio alerts from the cTrader Sounds folder.
  • Sound File Names: Names of sound files to use for directional signals.


Вам также может понравиться
E7 Polynomial Regression Channel
Polynomial Regression Channel which also reflects the volatility of the underlying asset.
ICT Killzone and Sessions high_low
This indicator is an essential tool for traders seeking to visualize key trading sessions on their charts.
RT MACD Histogram
Enhance MACD Histogram! Visualize bull and bear price changes with vibrant colors for clearer, more insightful trading.
4MA
This indicator consists of 3 moving averages that can be configured to your liking, from the type of moving average....
Индикатор
forex
indices
vwap
+14
Volume Profile Pivot Anchored
Anchor volume profiles to pivots with POC, VAH, VAL and real-time insights for clearer trade decisions.
Simple MACD Histogram
Simple MACD Histogram with color-coded rising (green) and falling (red) momentum bars.
support and resistance
Support and Resistance Line Indicator with Higher Timeframe Filter
Dynamic Candle Timer v1.5 2025
Dynamic Candle Timer is a fully customizable feature-packed indicator that offers multiple count-down/up modes and...
Fibonacci Pitchfan
Powerful all-in-one tool for traders seeking a clear, dynamic view of market structure. By merging pivots, trendlines &
Индикатор
breakout
supertrend
rsi
+1
ZScore
Z-Score measures price deviation from its average, helping identify extremes, trends, and trading opportunities ........
Индикатор
indices
rsi
signal
[Stellar Strategies] MARSI Signal Plotter
🚀📈 Plot buy/sell signals on Range Bars using Moving Averages and RSI. Clear, actionable trading insights.🚀📈
Индикатор
forex
indices
crypto
+1
TwoSMA.cs
An indicator that accurately shows the trend direction. A vital tool for clear trading decisions.
Zero Lag MACD
Zero Lag MACD delivers ultra-responsive trend and divergence signals with minimal lag, empowering timely Forex entries.
True Trend H4
It draws a step line that visualize the movement of H4. Particularly effective when trade on lower timeframe.
MA Sabres
Conquer the markets with MA Sabres! This indicator spots trend flips with MAs and cool Sabre shapes & alerts.
VolumeColorBar
Color Volume Bars – Visualize Market Strength Instantly
Multi-Timeframe Market Levels
Unlock market insights with our Multi-Timeframe Market Levels indicator, enhancing your trading strategies effortlessly
KDJ
The KDJ oscillator display consists of 3 lines (K, D and J - hence the name of the display) and 2 levels.