
Описание
// ══════════════════════════════════════ ══════════════════════════════════════
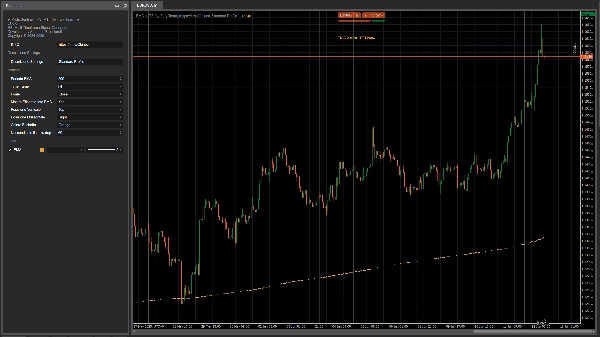
// 📊 ИНДИКАТОР EMA НА TF (МУЛЬТИ-ТАЙМФРЕЙМ)
// Версия: 1.0.0 - Профессиональный индикатор для анализа на нескольких таймфреймах
// Автор: Fury Team - Армандо Брецьяроли
// Дата: 5 июня 2025
// ══════════════════════════════════════════════════════════════════════════
//
// ОПИСАНИЕ:
// ===========
// EMA на TF — это продвинутый индикатор, который отображает экспоненциальную скользящую среднюю
// (EMA), рассчитанную на определённом таймфрейме и проецируемую на текущий
// таймфрейм графика. Этот инструмент позволяет использовать скользящие средние более высоких таймфреймов
// (например, H4, D1) даже на графиках с более низкими таймфреймами (M15, H1),
// обеспечивая полный и мгновенный мульти-таймфреймовый анализ.
//
// ОСНОВНЫЕ ХАРАКТЕРИСТИКИ:
// ==========================
// - Отображение EMA любого таймфрейма на текущем графике
// - Полная поддержка всех таймфреймов, доступных в cTrader
// - Полная настройка периода EMA и источника цены
// - Управление информационной меткой с гибким позиционированием
// - Надёжная система лицензирования и автоматическая проверка обновлений
// - Полная оптимизация для высокой производительности даже на больших объёмах данных
// - Полная настройка визуального оформления (цвета, стиль линий)
//
// ПРАКТИЧЕСКОЕ ПРИМЕНЕНИЕ:
// ================
// - Определение долгосрочного тренда на графике с более низким таймфреймом
// - Отображение значимых средних более высоких таймфреймов
// - Создание мульти-таймфреймовых стратегий на основе скользящих средних
// - Более надёжное определение динамических уровней поддержки и сопротивления
//
// ИСТОРИЯ ИЗМЕНЕНИЙ:
// =========
// v1.0.0 (05/06/2025)
// - Первоначальный выпуск с полной поддержкой всех таймфреймов
// - Реализация продвинутой системы управления лицензиями
// - Настраиваемый пользовательский интерфейс с информативным HUD
// - Добавлена информационная метка на графике
// - Интегрирована система автоматического обновления
// - Оптимизация производительности для расширенных временных рядов
// - Поддержка всех источников цены (Close, Open, High, Low и др.)
// - Автоматическое управление отображением системных сообщений
// ═══════════════════════════════════════════════════════════════════════════════
Для активации лицензии следуйте информации на экране или в логах.
Сводка
Отзывы покупателей
5 | 0 % | |
4 | 100 % | |
3 | 0 % | |
2 | 0 % | |
1 | 0 % |


