
Описание
- Что это делает (его ценность).
- Как это помогает трейдерам.
- Что делает его уникальным.
- Как использовать (кратко).
- Что откроет платная версия (тизер).
🔸
Индикатор Золотые Часы Сессии
(Бесплатная версия)
Описание
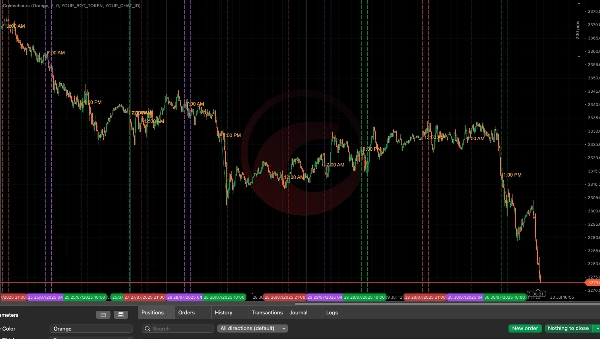
Индикатор Session Golden Hours предназначен для серьезных трейдеров, желающих визуализировать торговые окна с высокой вероятностью на основе моделей ликвидности, основанных на сессиях. Этот инструмент автоматически выделяет ключевые временные периоды в сессиях Азии, Лондона и Нью-Йорка — часто называемых «золотыми часами» рынка — когда цена с наибольшей вероятностью выйдет из диапазона и покажет институциональные намерения.
Что он делает:
- Отслеживает максимумы/минимумы азиатской сессии (00:00–08:00 UTC) для отображения зон ликвидности.
- Выделяет ключевые часы Лондона и Нью-Йорка такие как:
-
- Предзакрытие Лондона (06:00–07:00 UTC)
- Час закрытия Лондона (07:00–08:00 UTC)
- Зона дневного сдвига Нью-Йорка (13:00–14:00 UTC)
- Рисует визуальные ориентиры на вашем графике, чтобы сфокусировать внимание на часах дневного прорыва.
Как это помогает вам:
- Легко обнаруживать зоны ликвидности во время пересечений сессий.
- Фокусировать торговые решения вокруг временных рамок умных денег — больше никакой торговли в мертвых зонах.
- Визуально распознавать, где обычно происходят ложные пробои и развороты.
- Работает с любым инструментом и любым таймфреймом , который следует глобальным циклам сессий.
Ключевые особенности:
- Регулируемый цвет линии, толщина и временные расширения.
- Автоматическое отслеживание сессий без ручного нанесения.
- Встроенная поддержка 15 последних торговых дней.
- Чистая, ненавязчивая визуализация на графике.
Отлично подходит для:
- Трейдеров в стиле ICT (модели ликвидности и тайминга)
- Скальперов по прайс экшену
- Трейдеров, использующих временные конгруэнции
🔓 Хотите больше?
Платная Pro версия (скоро) добавит:
- Оповещения о прорывах в реальном времени напрямую в Telegram
- Логика для ложных пробоев в Азии → разворотов в Лондоне и максимумов/минимумов Лондона → разворотов в Нью-Йорке
- Умный таймер охлаждения для предотвращения избыточных оповещений
- Полное отслеживание максимумов/минимумов сессий с маркировкой сигналов
- Планы на будущее: оповещения FVG, внутренние зоны ликвидности и фильтрация сигналов
Сводка
Отзывы покупателей
5 | 0 % | |
4 | 100 % | |
3 | 0 % | |
2 | 0 % | |
1 | 0 % |


