Description
Un indicateur propre, simple et très visuel qui détecte les croisements entre deux Moyennes Mobiles Simples (SMA) et affiche tout clairement sur le graphique.
Caractéristiques principales :
- Grandes flèches colorées exactement au point de croisement → Vert citron ↑ → Croisement haussier (achat potentiel) → Rouge ↓ → Croisement baissier (vente potentielle)
- Panneau de statut permanent dans le coin supérieur droit du graphique → Type du dernier croisement (HAUSSIER / BAISSIER / EN ATTENTE) → Date et heure exactes du croisement → Périodes configurées des moyennes mobiles
- 100 % sans réaffichage
- Évite les signaux en double sur la même barre
- Affiche des messages dans le journal à chaque croisement (idéal pour le suivi)
- Très léger – fonctionne parfaitement sur n'importe quelle unité de temps
Ma façon préférée de l'utiliser (et celle que je recommande) :
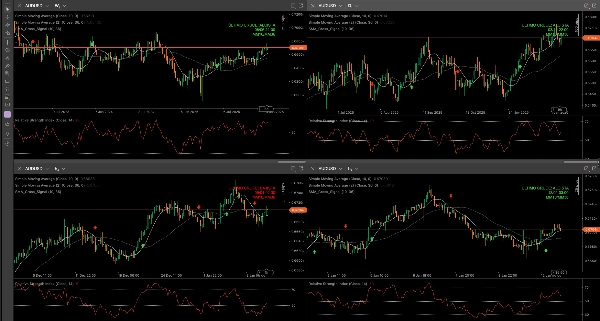
Je l'applique simultanément sur les Hebdomadaire, Journalier, H4, et H1 des mêmes paires de devises.
Je prends principalement mes entrées sur H1, mais avoir l'indicateur sur les unités de temps supérieures me donne une vue d'ensemble très puissante de la direction dominante de la paire :
- Les croisements haussiers/baissiers sont-ils alignés sur Hebdomadaire et Journalier ? → Probabilité plus élevée
- Signaux contradictoires entre les unités de temps ? → Mieux vaut attendre ou réduire la taille de la position
Configurations populaires qui fonctionnent bien :
- 9 / 21
- 10 / 30
- 21 / 50
- 50 / 200 (particulièrement utile sur les graphiques Hebdomadaire et Journalier)
Parfait pour les débutants (grâce à ses visuels clairs et sa simplicité) ainsi que pour les traders expérimentés cherchant une base propre à combiner avec l'Action des Prix, le support/résistance ou le volume.
Complètement gratuit pour toute la communauté cTrader !
Essayez-le en démo, appliquez-le en mode multi-unités de temps, et si vous l'aimez… n'hésitez pas à laisser un commentaire avec vos réglages préférés ou la paire sur laquelle il fonctionne le mieux pour vous 😊
Bon trading à tous !
Résumé
Key features include non-repainting signals, prevention of duplicate alerts on the same bar, and log messages for each crossover event. The indicator is lightweight and compatible with any timeframe, making it suitable for multi-timeframe analysis. Commonly used SMA period pairs include 9/21, 10/30, 21/50, and 50/200, with the latter especially useful on weekly and daily charts.
Traders often apply the indicator simultaneously on weekly, daily, 4-hour, and 1-hour timeframes to gain a comprehensive view of market direction and improve entry timing. It supports various markets including Forex and popular symbols like EURUSD, GBPUSD, USDJPY, XAUUSD, and BTCUSD. The indicator is designed for both beginners and experienced traders seeking clear, straightforward moving average crossover signals.