คำอธิบาย
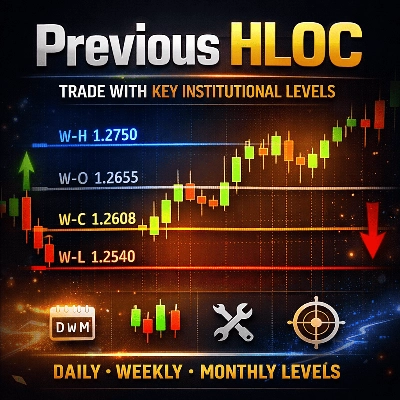
Previous HLOC – ระดับเวลาที่สูงกว่าที่ชาญฉลาดสำหรับการเทรดที่แม่นยำ
Previous HLOC เป็นตัวบ่งชี้หลายกรอบเวลามืออาชีพที่แสดง ระดับสูง ต่ำ เปิด และปิดของช่วงเวลาก่อนหน้า โดยตรงบนแผนภูมิของคุณด้วยความชัดเจนและการปรับแต่งที่เหนือชั้น
ออกแบบมาสำหรับ เทรดเดอร์ที่ใช้การเคลื่อนไหวของราคา, สแคปเปอร์, เทรดเดอร์รายวัน และเทรดเดอร์สวิง ตัวบ่งชี้นี้ช่วยให้คุณระบุได้ทันที ระดับสถาบันสำคัญ ที่มักทำหน้าที่เป็น แนวรับ แนวต้าน โซนปฏิเสธ และเป้าหมายสภาพคล่อง.
ทำไมต้อง Previous HLOC?
ตลาดตอบสนองอย่างสม่ำเสมอต่อ ระดับของวัน สัปดาห์ และเดือนก่อนหน้า สถาบัน อัลกอริทึม และเทรดเดอร์มืออาชีพติดตามระดับเหล่านี้อย่างใกล้ชิด
Previous HLOC นำราคาสำคัญเหล่านั้นมาไว้บนแผนภูมิของคุณในรูปแบบที่สะอาดและไม่มีสิ่งรบกวน—เพื่อให้คุณไม่พลาด
คุณสมบัติหลัก
✅ ระดับหลายกรอบเวลา
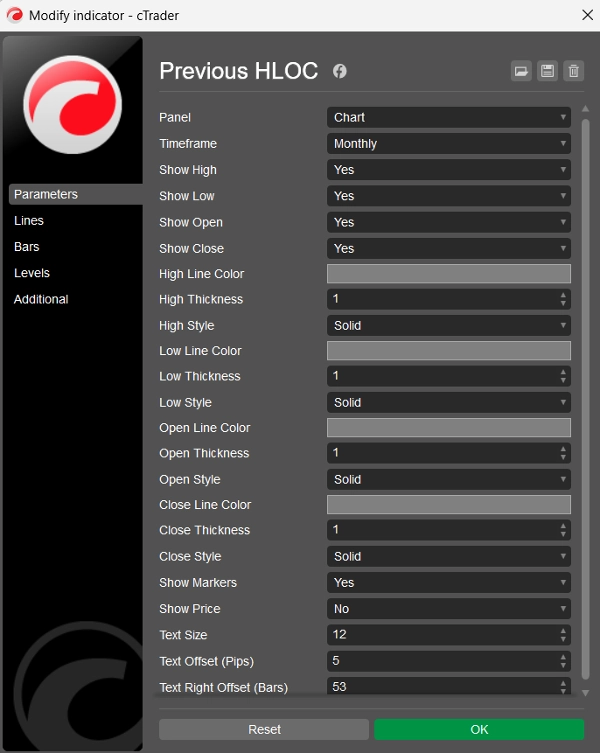
- เลือก ระดับแท่งเทียนก่อนหน้ารายวัน รายสัปดาห์ รายเดือน หรือรายชั่วโมง
- ระดับยังคงถูกต้องไม่ว่าจะใช้กรอบเวลาใดบนแผนภูมิของคุณ
✅ การควบคุม HLOC เต็มรูปแบบ
- เปิดหรือปิดใช้งาน สูง ต่ำ เปิด ปิด แยกกัน
- เทรดเฉพาะสิ่งที่สำคัญต่อกลยุทธ์ของคุณ
✅ การปรับแต่งขั้นสูง
- แยก สี ความหนา และสไตล์เส้น สำหรับแต่ละระดับ
- เครื่องหมายฟอนต์ Consolas ที่สะอาดตา พร้อมขนาดข้อความที่ปรับได้
- แสดงราคาตัวเลือกถัดจากเครื่องหมายแต่ละอัน
✅ เครื่องหมายลอยชาญฉลาด
- เครื่องหมายเคลื่อนที่อย่างเป็นธรรมชาติกับแผนภูมิ
- อยู่ในแนวเดียวกับระดับราคาเสมอขณะเลื่อน
- วางไว้ทาง ด้านขวาเพื่อความชัดเจน
✅ ระดับที่คาดการณ์ในอนาคต
- เส้นขยายไปไกลในอนาคต
- เหมาะสำหรับ การวางแผนเข้าซื้อ ขาย หยุดขาดทุน และทำกำไร
🔹 วิธีที่เทรดเดอร์ใช้
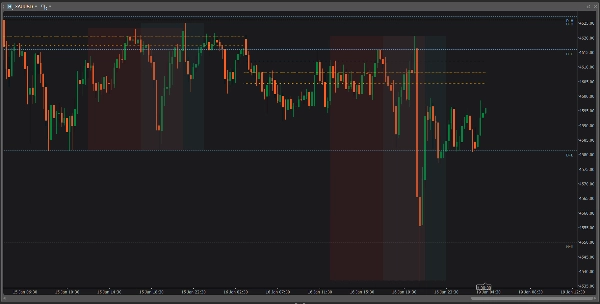
📌 ระบุ แนวรับและแนวต้านภายในวันที่แข็งแกร่ง
📌 ใช้ระดับสูง/ต่ำก่อนหน้าเป็น โซนสแกนสภาพคล่อง
📌 เทรด การเบรคเอาท์ การปฏิเสธ และการทดสอบซ้ำ
📌 จัดตำแหน่งเข้าซื้อให้สอดคล้องกับ แนวโน้มกรอบเวลาที่สูงกว่า
📌 ปรับปรุง ความแม่นยำของความเสี่ยงและผลตอบแทน
🔹 ตัวบ่งชี้นี้เหมาะกับใคร?
✔ เทรดเดอร์ฟอเร็กซ์
✔ เทรดเดอร์ดัชนีและสินค้าโภคภัณฑ์
✔ สแคปเปอร์และเทรดเดอร์รายวัน
✔ เทรดเดอร์สวิง
✔ เทรดเดอร์ที่ใช้การเคลื่อนไหวของราคาและ SMC
🔹 สะอาด รวดเร็ว เชื่อถือได้
- ไม่มีการวาดซ้ำ
- ไม่มีความล่าช้า
- ไม่มีความยุ่งเหยิง
- ใช้งานได้กับ สัญลักษณ์และกรอบเวลาทุกประเภท
🔹 สรุป
Previous HLOC ไม่ใช่แค่ตัวบ่งชี้ระดับทั่วไป—แต่เป็น เครื่องมือเทรดมืออาชีพ ที่ช่วยให้คุณเทรดด้วย บริบท โครงสร้าง และความมั่นใจ.
ถ้าคุณเทรดรอบ ระดับช่วงเวลาก่อนหน้า ตัวบ่งชี้นี้ควรอยู่บนแผนภูมิของคุณ
สรุป
รีวิวจากลูกค้า
5 | 100 % | |
4 | 0 % | |
3 | 0 % | |
2 | 0 % | |
1 | 0 % |


