Descrição
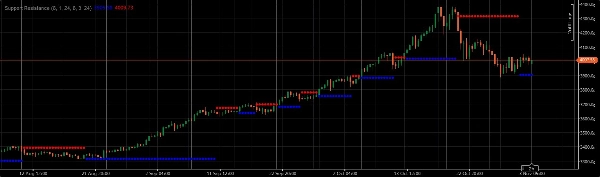
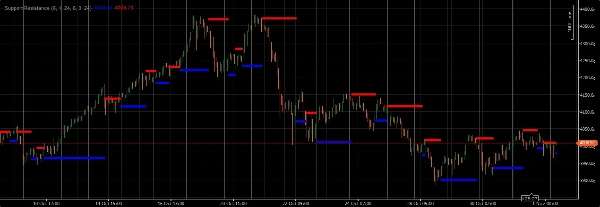
Ao negociar ouro, use níveis de suporte e resistência em vários períodos de tempo (gráficos grandes, de intervalo e de ticks) para identificar possíveis rompimentos de pivô ou pontos de suporte/resistência. Sempre confirme esses sinais com outros indicadores técnicos, como médias móveis, osciladores e padrões de velas, para negociações com maior probabilidade.
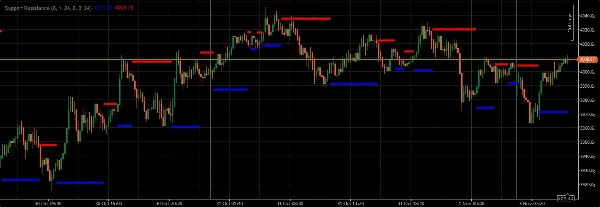
Ao negociar ouro, use níveis de suporte e resistência em vários períodos de tempo (gráficos grandes, de intervalo e de ticks) para identificar possíveis rompimentos de pivô ou pontos de suporte/resistência. Ao negociar ouro, use níveis de suporte e resistência em vários períodos de tempo (gráficos grandes, de intervalo e de ticks) para identificar possíveis rompimentos de pivô ou pontos de suporte/resistência. Esses níveis, uma vez identificados, podem servir como pontos cruciais de decisão. Um rompimento acima da resistência ou abaixo do suporte, especialmente quando acompanhado por um aumento no corpo da vela, frequentemente sinaliza uma continuação da tendência ou uma mudança significativa no sentimento do mercado. Por outro lado, um repique em um nível de suporte ou uma rejeição na resistência pode indicar uma reversão potencial ou uma continuação da consolidação atual. Sempre confirme esses sinais com outros indicadores técnicos, como médias móveis, osciladores e padrões de velas, para negociações com maior probabilidade. Além disso, preste muita atenção a eventos de notícias e divulgações de dados econômicos, pois estes podem impactar dramaticamente os preços do ouro e invalidar configurações puramente técnicas. A gestão de risco é fundamental; nunca arrisque mais do que uma pequena porcentagem do seu capital de negociação em qualquer operação única.
Resumo
Avaliações de clientes
5 | 100 % | |
4 | 0 % | |
3 | 0 % | |
2 | 0 % | |
1 | 0 % |


