📈 Indicateur de Biais de Volatilité Skew – Version Professionnelle (pour cTrader)
Découvrez une compréhension plus approfondie de la pression du marché, du déséquilibre de volatilité et de la conviction directionnelle avec le Indicateur de Biais de Volatilité Skew, la version améliorée d'une approche classique basée sur la volatilité initialement inspirée par Pine Script et maintenant entièrement optimisée pour cTrader.
Cet outil aide les traders à visualiser quel côté du marché frappe le plus fort — acheteurs ou vendeurs — en mesurant l'asymétrie de volatilité et en la convertissant en un signal clair et facile à lire.
Que vous tradiez des indices, du forex, des matières premières ou des cryptomonnaies, cet indicateur sert de filtre de tendance, détecteur de régime et outil de confirmation de biais puissant.
1. Ce que mesure l'indicateur Skew
L'indicateur évalue le déséquilibre de volatilité entre les chandeliers haussiers et baissiers.
Il calcule une True Range normalisée et l'intègre dans deux moyennes adaptatives :
- Déviation Max → volatilité produite pendant les chandeliers haussiers
- Déviation Min → volatilité produite pendant les chandeliers baissiers
Ensuite, il calcule :
👉 Skew = DéviationMax / DéviationMin
Cela convertit la volatilité brute en une lecture directionnelle claire :
- Skew > 1 → les mouvements à la hausse sont en moyenne plus forts
- Skew < 1 → les mouvements à la baisse sont plus forts
- Skew ≈ 1 → la volatilité est symétrique et le marché est équilibré
En résumé :
Skew révèle quel côté détient la « dominance de volatilité ».
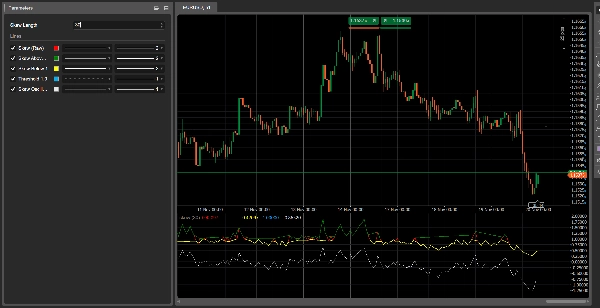
2. Comprendre les lignes
1. Skew (brut) – Ligne rouge
Le ratio de volatilité pure. C'est le signal principal.
2. Skew au-dessus de 1 – Ligne verte
Montre la dominance de volatilité haussière.
3. Skew en dessous de 1 – Ligne jaune
Montre la dominance de volatilité baissière.
4. Ligne Seuil 1.0 – Ligne bleue en pointillés
Représente l'équilibre.
5. Oscillateur Skew (log) – Ligne blanche
Représentation plus stable et plus lisse :
- au-dessus de 0 = volatilité haussière
- en dessous de 0 = volatilité baissière
3. Comment le lire
A) Régimes de marché
🔹 Régime haussier
- Skew > 1
- Ligne verte active
- Oscillateur au-dessus de zéro
→ Le marché favorise les positions longues.
🔹 Régime baissier
- Skew < 1
- Ligne jaune active
- Oscillateur en dessous de zéro
→ Le marché favorise les positions courtes.
🔹 Neutre
- Skew ≈ 1
→ Marché équilibré, adapté au trading en range.
4. Signaux de changement de régime
Skew franchissant la barre de 1 vers le haut
→ Les acheteurs gagnent la dominance de volatilité
→ Transition haussière
Skew franchissant la barre de 1 vers le bas
→ Les vendeurs gagnent la dominance de volatilité
→ Transition baissière
Ces changements surviennent souvent avant que l'action des prix confirme une tendance, faisant de Skew un indicateur précoce puissant.
5. Cas d'utilisation pratiques
1️⃣ Filtre de tendance pour cBots
- trader long uniquement lorsque SkewOsc > 0
- trader short uniquement lorsque SkewOsc < 0
2️⃣ Confirmation de la qualité de la tendance
- Tendance haussière + Skew > 1 = tendance forte
- Tendance haussière + Skew tendant vers 1 = tendance qui s'affaiblit
3️⃣ Sentiment du marché / Filtre de risque
Particulièrement efficace sur les indices et les principales paires FX.
6. Résumé
- Ce qu'il montre : dominance de volatilité
- Pourquoi c'est important : les changements de volatilité précèdent les changements de prix
- Comment l'utiliser : comme filtre, outil de confirmation ou jauge de sentiment
- Le meilleur : extrêmement léger, rapide et adaptable
5 | 67 % | |
4 | 33 % | |
3 | 0 % | |
2 | 0 % | |
1 | 0 % |


![Logo de "[Hamster-Coder] Pivot Points MTF"](https://cdn.ctrader.com/image/webp/4c143e5a-309c-40e3-a578-f04d1e133ffa_31159)


