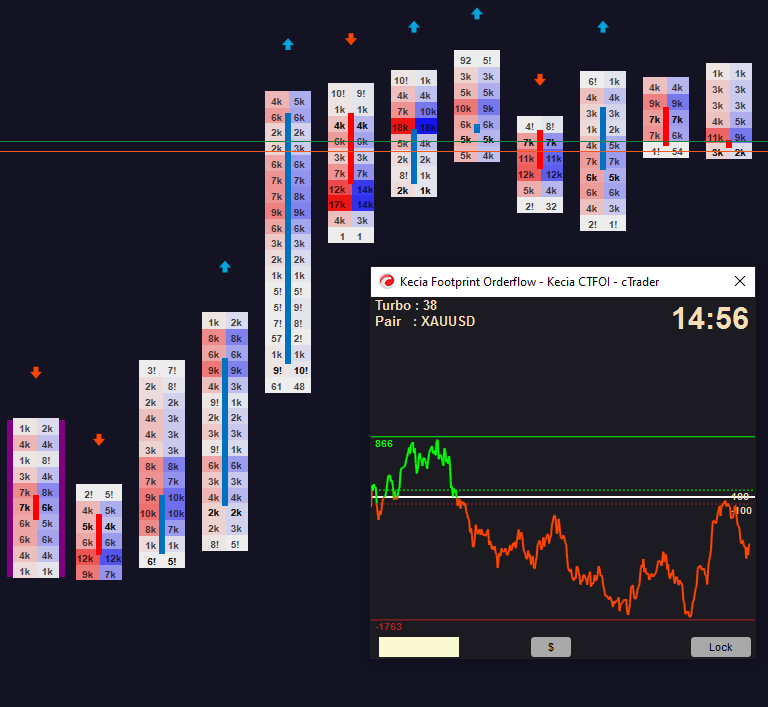
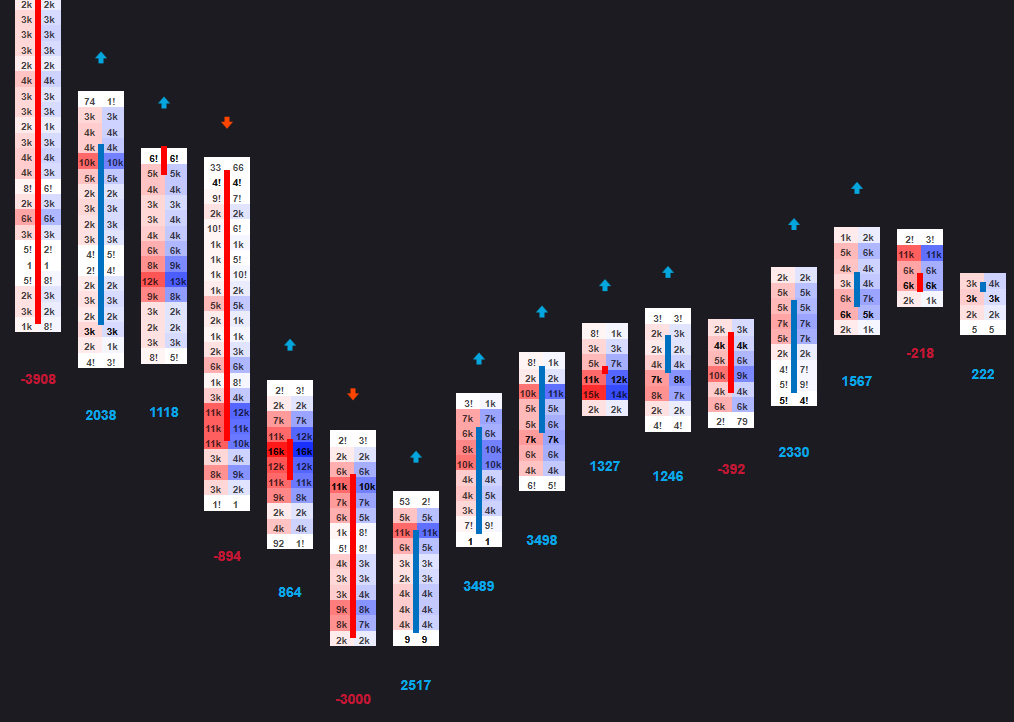
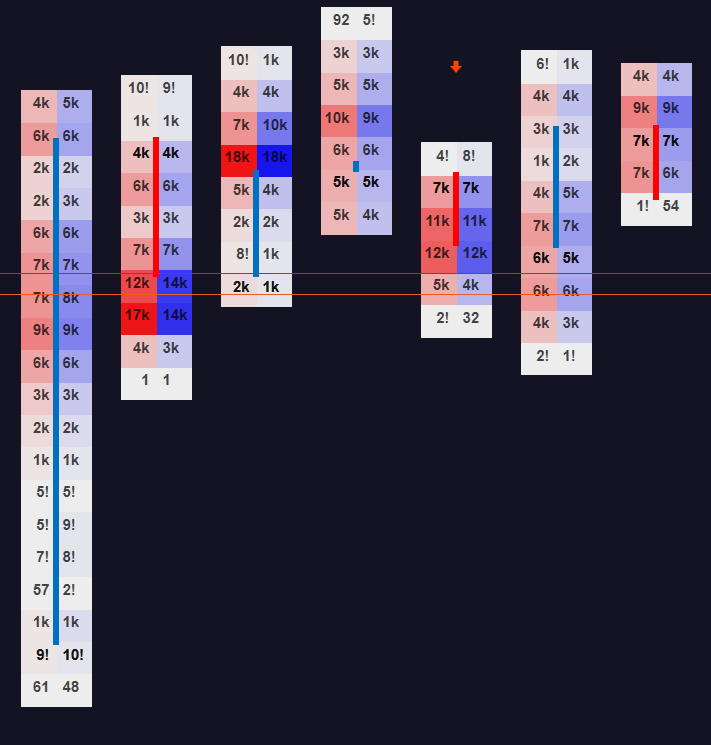
Designed to help traders gain a deeper understanding of the market’s true order flow dynamics. By visualizing the “footprints” left by candles, this indicator reveals how the delta (the difference between buying and selling pressure) changes during the candle formation, as well as how volume fluctuates at different price levels. These insights are essential for traders seeking to identify reversals, breakouts, and key support or resistance zones based on the underlying order flow.
What sets this indicator apart is its ability to display bid-ask imbalances and its comprehensive visualization of how the market's order flow evolves. With this tool, traders can precisely track volume changes and delta variations to understand where significant shifts in market sentiment are occurring, helping you to make better-informed trading decisions.
It is important to note that the footprint data presented by this indicator is an approximation rather than an exact representation of the real volume. This is because cTrader does not natively offer access to raw, real-time order flow data at the tick level. As such, the Kecia Footprint Orderflow indicator uses available data to estimate volume during tick movements, providing you with a close approximation of market behavior, but not an exact picture of the actual order volume. Despite this limitation, the indicator performs its best to “understand” the real volume during tick formations, enabling traders to make informed decisions based on an educated estimation of market activity.
Practical Applications
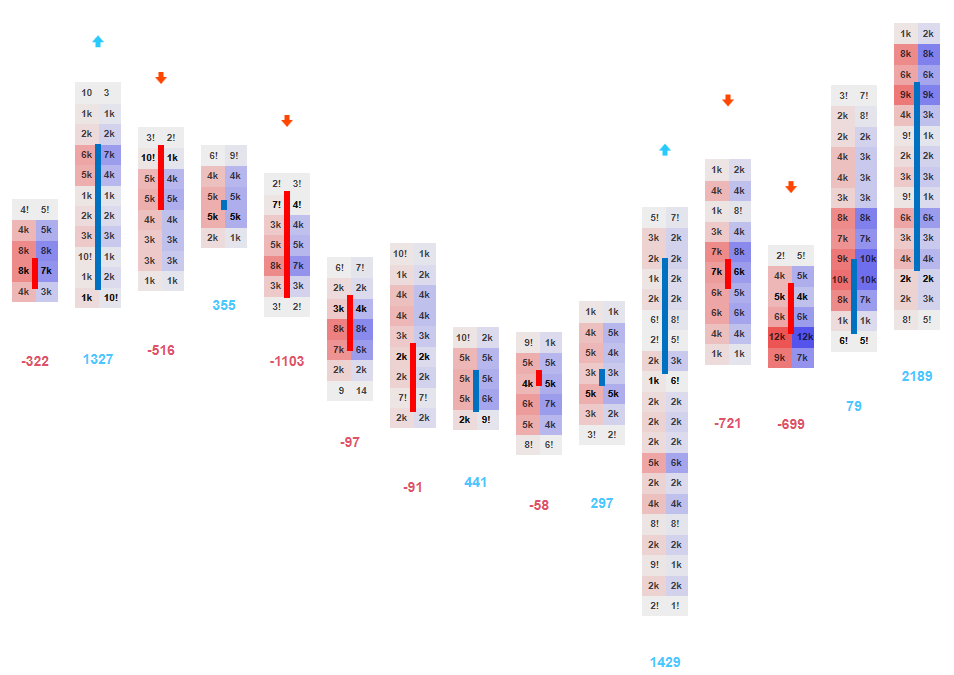
- Spotting Reversals:
- This indicator is ideal for spotting potential reversal points. When a price trend starts to lose momentum, the delta and volume data become crucial for confirming whether a reversal is about to take place. If delta shifts dramatically from negative to positive (or vice versa), accompanied by a volume spike, the indicator marks this with arrows, alerting you to a potential shift in market sentiment.
- For example, during a bullish trend, if the delta shows increasing selling pressure or negative delta values, it could signal a weakening uptrend and a possible reversal. Conversely, during a downtrend, a spike in buying pressure and positive delta can indicate the beginning of a bullish reversal.
- Identifying Breakouts:
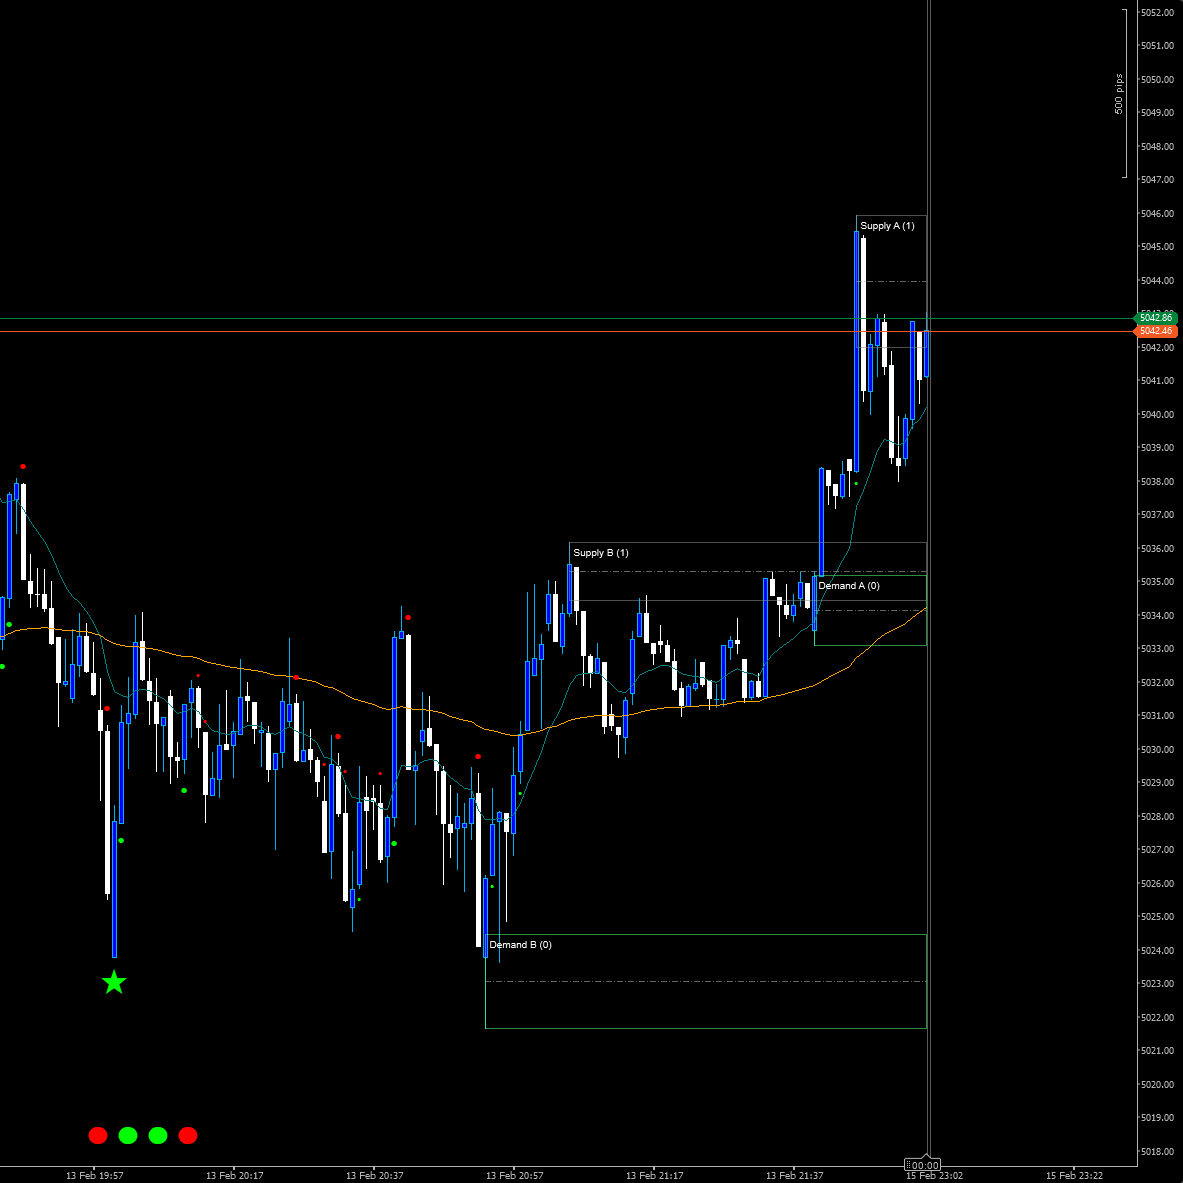
- Breakouts are often the result of a significant imbalance between buyers and sellers. The Kecia Footprint Orderflow indicator tracks these imbalances by showing large delta shifts and volume spikes, especially at key price levels such as support and resistance zones.
- When the delta crosses a specific threshold (set by the user), and there is a surge in volume, it signals that a breakout is likely. The indicator will plot arrows at these levels, providing early warnings of breakout opportunities.
- By combining delta variations and volume analysis, traders can confidently enter trades in the direction of the breakout, armed with real-time data confirming the strength of the move.
- Confirming Trend Strength:
- This indicator is not just useful for spotting reversals and breakouts—it can also help confirm the strength of an ongoing trend. If the delta continues to show increasing buying or selling pressure in the direction of the trend, it’s a sign that the trend is likely to continue. This information is critical when deciding whether to hold onto a position or exit early.
- For example, if the market is in an uptrend, and delta shows persistent positive values (buying pressure) with increasing volume, you can be more confident that the trend will continue. On the other hand, if delta starts fluctuating or moving in the opposite direction, it might be a sign that the trend is weakening, and a reversal could be imminent.
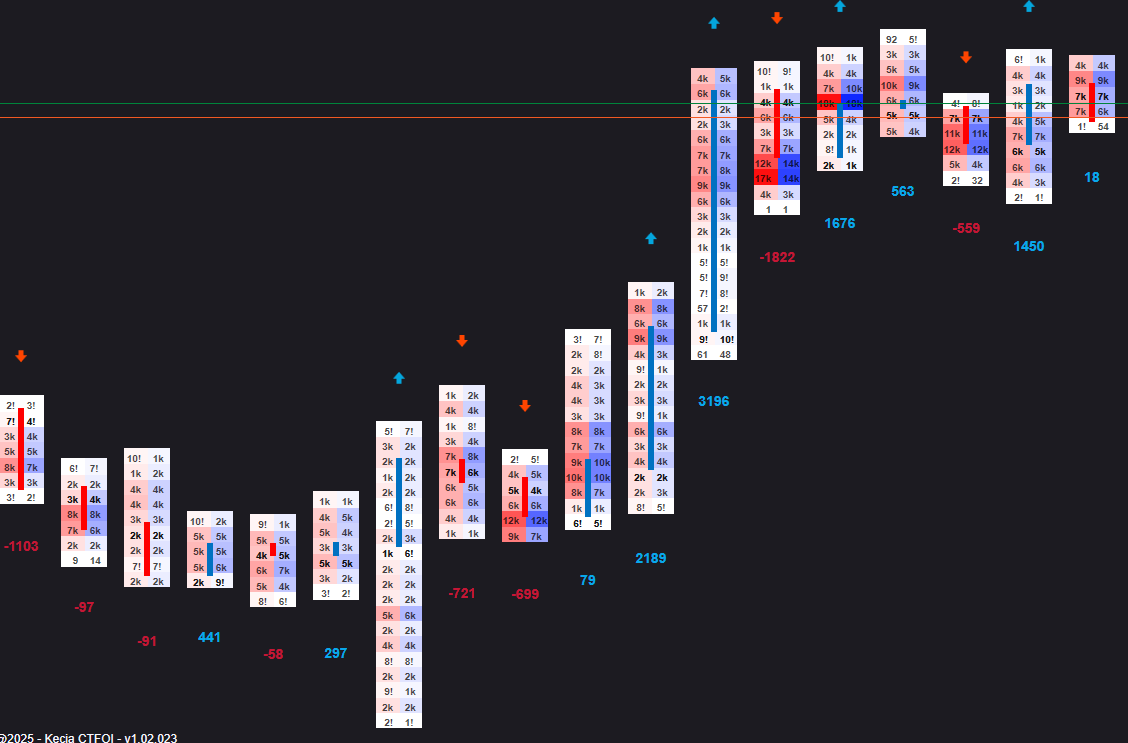
- Volume Analysis for Market Sentiment:
- Volume is an essential tool for confirming price moves and understanding the market’s true sentiment. The Kecia Footprint Orderflow indicator allows you to see where large volumes are concentrated at specific price levels. This data helps identify high-interest zones where significant market participants are positioning their orders.
- For example, if a price moves higher with increasing volume and a positive delta, it signals strong buying pressure and a bullish sentiment. If volume decreases while the price continues to rise, it might signal a weakening trend, suggesting that the price move could soon reverse.
- By analyzing the volume profile and delta in real time, the indicator allows you to understand how market sentiment is evolving and adjust your strategy accordingly.
- Bid-Ask Imbalances for Price Confirmation:
- The Kecia Footprint Orderflow indicator also helps identify bid-ask imbalances, a crucial tool for understanding the underlying strength of price movements. These imbalances reveal where there is more buying or selling pressure at specific price levels.
- When the ask (sell orders) outweighs the bid (buy orders), it can indicate that sellers are in control, potentially pushing the price lower. Conversely, when the bid outweighs the ask, buyers are in control, and the price may rise. By identifying these imbalances in real time, you can anticipate price movements before they are fully reflected in the chart, giving you a key advantage in fast-moving markets.
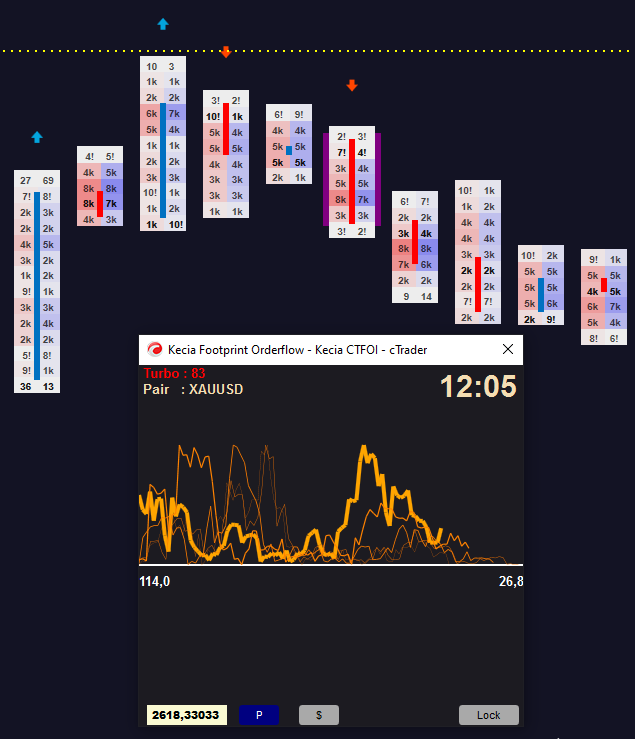
2025 New Feature: Interactive Candle Analysis
In addition to these practical applications, the Kecia Footprint Orderflow indicator includes an interactive feature that significantly enhances the trader's ability to analyze price action.
- Interactive Delta and Volume Analysis:
- By simply clicking on any candle, a pop-up window appears showing detailed information about how delta has varied during the candle’s formation. The window will display the maximum and minimum delta values, offering insights into the buying and selling pressure throughout the candle’s life. This helps you understand how momentum shifted during the candle’s formation and whether the price movement was backed by strong order flow or weaker participation.
- Volume Vibration Chart:
- An additional feature within the pop-up window is the “Vibration Chart”. When you press the "$" button, a reference line will be drawn on the chart at the selected price level (after that, press the "p" button). This reference price then allows you to visualize how the volume behaves relative to this price point, known as the Volume Vibration Chart.
- As price approaches the reference line, the Vibration Chart reveals how volume fluctuates, helping you understand the concentration of market participants at this price level. This feature is particularly useful for spotting areas of high interest or anticipating price reactions at critical levels. If the volume increases as the price approaches the reference line, it may signal that traders are becoming more interested in this price level, which could result in significant price action.
Technical Features
(The "Lock" button will fix the analysis to the most recent candle, meaning it will automatically update to analyze the last formed candle as new candles are created.)
To tailor the Kecia Footprint Orderflow indicator to your trading needs, it comes with several customizable settings:
- Delta Saturation Value:
- The delta saturation value sets a threshold for significant delta imbalances. If delta exceeds this value, the indicator will plot arrows to highlight these important levels, making it easy to spot strong buying or selling pressure. A higher value filters out smaller shifts in delta, while a lower value will show more sensitive changes in market sentiment.
- AlphaPips:
- This parameter helps filter the data for display clarity. By adjusting the AlphaPips value, you can control how granular or broad the footprint data appears on the chart. This allows you to either zoom in on detailed order flow changes or broaden the data for a higher-level view.
- PipsCorrection:
- This feature corrects pip calculations, ensuring the indicator displays accurate price levels for the asset you are trading. It’s especially important when trading instruments with varying pip values, ensuring that the footprint is properly aligned with the chart’s price scale.
- Volume Correction:
- The volume correction adjusts the way volume is calculated and displayed, providing more accurate volume data. This feature helps refine the indicator’s volume analysis, making sure it accurately reflects market participation, even in fast-moving or illiquid assets.
- Row Height:
- The row height determines the size of the footprint rectangles, measured in pips. It’s essential to set this value carefully—too low, and the chart may become cluttered or cause software performance issues. For most trading pairs, the optimal value is typically 1 pip per rectangle, ensuring clarity without causing performance slowdowns.
!["Session Volume Profile (SVP) [Iridio Capital]" logosu](https://cdn.ctrader.com/image/png/ea8d1285-8653-4881-adfb-89d8ce6c0347_1347)