
Tracking Performance by Quantara
Gösterge
31 i̇ndirmeler
Sürüm 1.0, Feb 2026
Windows, Mac
Açıklama
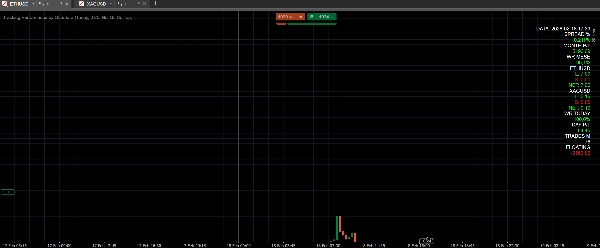
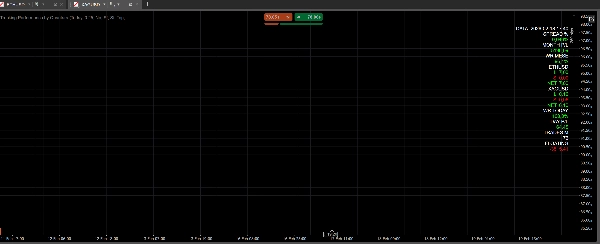
Quantara tarafından Performans Takibi, gerçek zamanlı performans metriklerini ve varlık başına maruziyeti gösteren bir gösterge panelidir.
Aylık ve günlük K/Z, aylık ve günlük kazanma oranı, aylık işlem sayısı, açık K/Z, yüzde olarak spread ve her açık varlık için uzun/kısa/net değerlerini gösterir.
Tüm değerler hızlı okunma için renk kodludur (pozitif/negatif K/Z, kazanma oranı eşikleri, uzun yeşil, kısa kırmızı).
Hesapladığı/gösterdiği
- Spread % (metaller ve kripto için farklı eşikler ile)
- Aylık ve günlük K/Z
- Aylık ve günlük kazanma oranı
- Aylık işlem sayısı
- Açık K/Z
- Varlık başına maruziyet (uzun / kısa / net)
Önerilen enstrümanlar/zaman dilimleri
- Herhangi bir enstrüman ve herhangi bir zaman diliminde
- Günlük izleme için ana grafiklerde (M15–H4) önerilir
Nasıl kullanılır
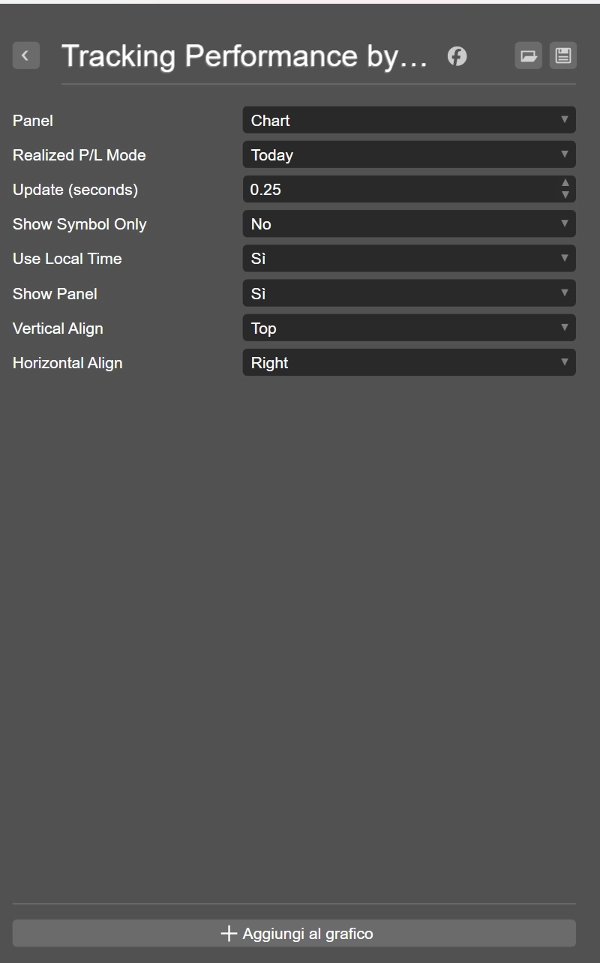
- Göstergeleri bir grafiğe ekleyin
- Güncelleme aralığını ayarlayın (Güncelleme saniyeleri)
- Görünürlüğü değiştirmek için Paneli Göster kullanın
- Grafik sembolüne filtrelemek için “Sadece Sembolü Göster” kullanın
- Yerel zaman filtrelerini uygulamak için “Yerel Zamanı Kullan” seçeneğini kullanın
Ana parametreler
- Güncelleme (saniye): yenileme sıklığı
- Sadece Sembolü Göster: sadece grafik sembolünü göster
- Yerel Zamanı Kullan: filtreler için yerel zamanı kullan
- Paneli Göster: paneli göster/gizle
- Dikey/Yatay Hizalama: panel yerleşimi
Kullanım alanları
- Varlık başına net maruziyetin hızlı kontrolü
- Günlük ve aylık performans takibi
- Operasyonel kalite için kazanma oranı takibi
- Metaller ve kripto için spread % takibi
Feragatname
Ticaret risk içerir. Geçmiş performans gelecekteki sonuçları garanti etmez.
Özet
YZ özeti
Tracking Performance by Quantara is a dashboard indicator designed for real-time monitoring of trading performance across multiple assets. It provides key metrics including monthly and daily profit and loss (P/L), win rate, trade count, floating P/L, and spread percentage, with specific thresholds for metals and cryptocurrencies. The indicator also displays per-asset exposure categorized as long, short, or net positions. All values are dynamically color-coded to facilitate quick interpretation, highlighting positive/negative P/L, win-rate levels, and position types.
This tool is compatible with any trading instrument and timeframe, with a recommendation for use on main charts ranging from 15-minute to 4-hour intervals for daily performance tracking. Users can customize update frequency, toggle panel visibility, filter data to the current chart symbol, and apply local time settings. The indicator supports quick assessment of net exposure, daily and monthly performance, win-rate monitoring, and spread percentage analysis for metals and crypto markets.
Key parameters include update interval, symbol filtering, local time usage, panel display options, and panel alignment. This indicator is applicable across Forex, Indices, Commodities, Crypto, and Stocks markets.
Gösterge profili
Müşteri değerlendirmeleri
0.0
Değerlendirmeler: 0
Müşteri değerlendirmeleri
Bu ürün için henüz bir değerlendirme yok. Ürünü denediniz mi? O zaman ona dair görüşlerini paylaşan ilk kişi olun!
Tartışma
SSS
Forex
Indices
Commodities
Crypto
Stocks
cTrader Store üzerinden erişilebilen işlem botları, göstergeler ve eklentiler gibi ürünler, üçüncü taraf sağlayıcılar tarafından sağlanır ve yalnızca bilgilendirme ve teknik erişim amaçlarıyla sunulur. cTrader Store bir broker değildir ve yatırım tavsiyesi, kişisel öneriler vermez veya gelecekteki performansı garanti etmez.


Fiyat
Başlangıç 29/01/2026
31
Ücretsiz yüklemeler