present
Kaydolun ve ilk alışverişinizde $50 indirim kazanın
Trading product for Volume_Momentum_HeatMap-Liquidity-style Gösterge Scalping Key Levels, image 1
Volume_Momentum_HeatMap-Liquidity-style
Gösterge
Sürüm 2.0, Apr 2026
Windows, Mac
4.5
Değerlendirmeler: 4
Trading product for Volume_Momentum_HeatMap-Liquidity-style Gösterge Scalping Key Levels, image 2
Trading product for Volume_Momentum_HeatMap-Liquidity-style Gösterge Scalping Key Levels, image 3
Trading product for Volume_Momentum_HeatMap-Liquidity-style Gösterge Scalping Key Levels, image 4
Trading product for Volume_Momentum_HeatMap-Liquidity-style Gösterge Scalping Key Levels, image 5
Başlangıç 23/04/2025
36.31M
İşlem hacmi
4.69K
Kazanılan pip
3
Satışlar

Açıklama

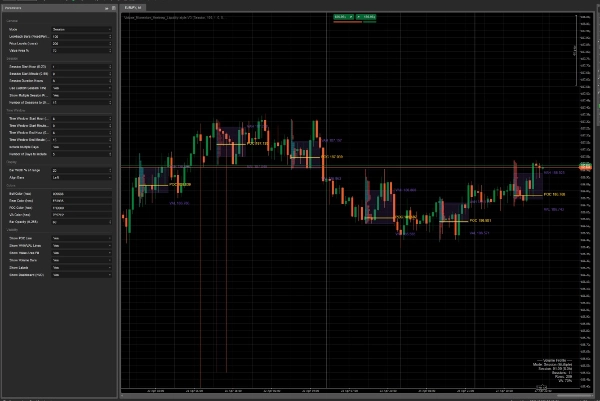
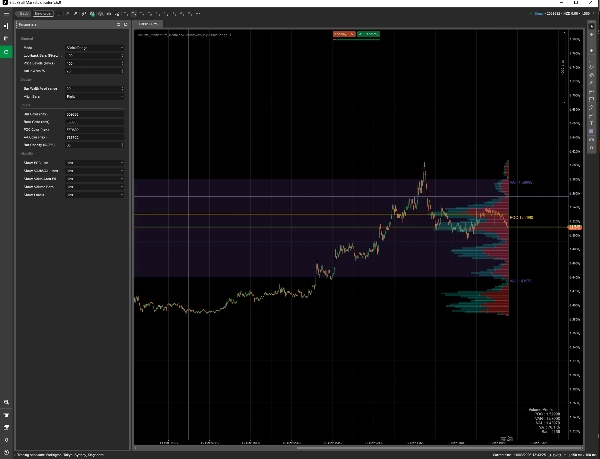
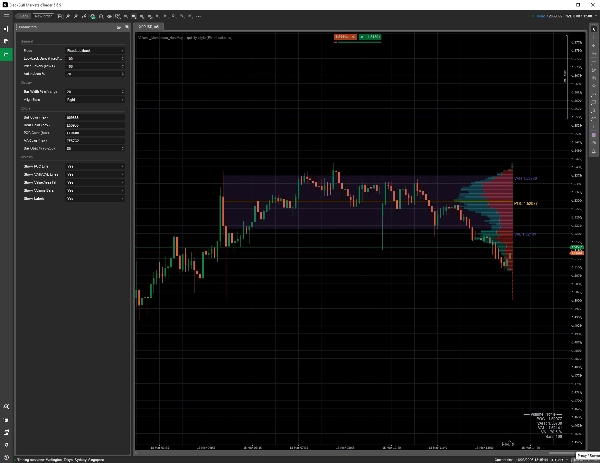
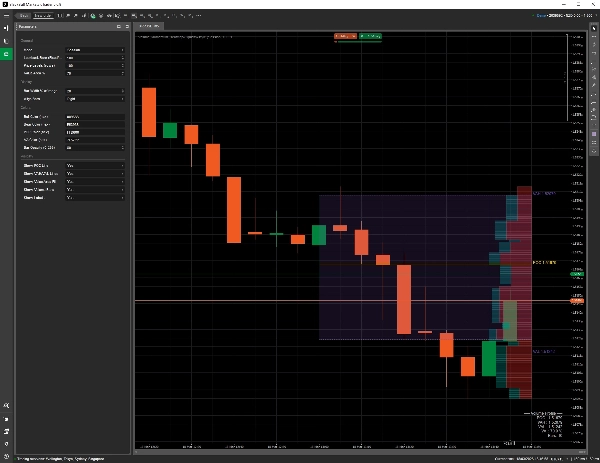
Volume Profile HeatMap, fiyat seviyeleri arasında ticaret aktivitesinin nerede yoğunlaştığını analiz etmek için kullanılan bir cTrader grafik göstergesidir. POC, değer alanı ve isteğe bağlı görsel ticaret senaryosu işaretçileri ile bir hacim profili tarzı ısı haritası çizer.


Ne yapar:

- Grafikte doğrudan bir hacim profili tarzı ısı haritası gösterir

- POC, VAH, VAL, yüksek hacimli düğümleri ve düşük hacimli alanları vurgular

- Görünür aralık, sabit geriye dönük, oturum ve zaman penceresi modlarını destekler

- Birden fazla oturum profilini gösterebilir

- İsteğe bağlı değer alanı dolgu, genişletilmiş değer alanı bölgeleri, etiketler ve gösterge paneli bilgileri çizer

- Görsel ticaret planlaması için isteğe bağlı desen etiketleri ve sinyal okları içerir

- Etkinleştirildiğinde görsel giriş, durdurma ve hedef senaryoları çizer


Ticaret yaklaşımı:

Gösterge, hacim yoğunluğu, değer alanı ve oturum bağlamını kullanarak manuel ticaret planlayan tüccarlar için tasarlanmıştır. Fiyatın daha önce değeri kabul ettiği veya reddettiği bölgeleri belirlemeye yardımcı olur, ancak bu bölgelerin canlı piyasa koşullarında geçerli olacağını garanti etmez.


Ana parametreler:

- Profil modu

- Geriye dönük bar sayısı

- Oturum başlangıç zamanı ve süresi

- Gösterilecek oturum sayısı

- Desen tanıma ve sinyal okları

- Zaman penceresi seçimi

- Fiyat seviyesi sayısı

- Değer alanı yüzdesi

- Bar genişliği ve hizalaması

- POC, VAH, VAL, değer alanı dolgu, etiketler ve gösterge paneli görünürlüğü

- Görsel ticaret senaryoları için risk/ödül oranı


Kimler için:

- Değer alanı ve POC seviyelerini kullanan günlük içi tüccarlar

- Görsel destek ve direnç bağlamı arayan tüccarlar

- cTrader içinde hacim profili tarzı bir üst bilgi isteyen manuel tüccarlar

- Oturum davranışını ve potansiyel tepki bölgelerini incelemek isteyen strateji testçileri


Önemli sınırlamalar:

Bu bir gösterge, ticaret robotu değildir. Canlı emir göndermez. Ticaret işaretçileri yalnızca görsel senaryolardır. Gösterge, cTrader içinde mevcut olan grafik/aracı hacim verilerini kullanır; bu veriler merkezi borsa hacmi veya vadeli işlem emir akışı verilerinden farklı olabilir.


Risk notu:

Ticaret risk içerir. POC, VAH, VAL, HVN ve LVN bölgeleri analiz araçlarıdır, garanti edilmiş dönüş veya kırılma seviyeleri değildir. Ayarları demo üzerinde test edin ve bağımsız risk yönetimi kullanın.


Özet

YZ özeti
Volume_Momentum_HeatMap-Liquidity-style is a cTrader chart indicator designed to visualize trading volume concentration across price levels using a volume-profile heatmap. It highlights key volume-based zones such as Point of Control (POC), Value Area High (VAH), Value Area Low (VAL), High Volume Nodes (HVN), and Low Volume Nodes (LVN). The indicator supports multiple profile modes including visible range, fixed lookback, session, and customizable time windows, allowing users to display one or multiple session profiles.

Key features include optional value area fills, extended value area zones, labels, and a dashboard for summary information. It also offers pattern recognition with signal arrows and visual trade scenario markers such as entry, stop, and target levels based on configurable risk/reward ratios. Users can adjust parameters like profile mode, lookback bars, session timing, number of price levels, and visibility of various elements to tailor the analysis.

This tool is intended for intraday and manual traders who utilize volume profile, value areas, and session context to identify support and resistance zones and plan trades visually. It relies on chart volume data available in cTrader and does not execute trades automatically. The indicator serves as an analytical overlay to assist in trade planning and session behavior review.
Gösterge profili
Gösterge kategorisi
Momentum
Çıktı türü
Görselleştirme
Sinyaller
Filtre
Veri gereklilikleri
Hacim
Desteklenen sinyaller
Volatilite
Seviyeye dokunuş
Seans açılış aralığı

Müşteri değerlendirmeleri

4.5
Değerlendirmeler: 4
5
50 %
4
50 %
3
0 %
2
0 %
1
0 %
Müşteri değerlendirmeleri
March 31, 2026
Not some auto win thing, but it has a clear role. It helps with smart money style analysis, while the weak spot is that zones still need manual validation. Early sizing should stay modest until the journal looks stable.
March 24, 2026
Tbh the value is mostly in filtering bad ideas. I still would not trust it live without checking the chart myself. The weak spot shows up when risk stops matching the setup.705 caution area.
March 22, 2026
the product feels more useful when the plan is already written down. A 97 setup run on daily close keeps the review grounded.
March 22, 2026
After 3 sessions, the useful part became clearer. 20 FVG reactions was enough to see whether it helped, and 0.5 mitigation kept the test grounded.

Tartışma

SSS

Scalping
Key Levels
Volume
Support & Resistance
cTrader Store üzerinden erişilebilen işlem botları, göstergeler ve eklentiler gibi ürünler, üçüncü taraf sağlayıcılar tarafından sağlanır ve yalnızca bilgilendirme ve teknik erişim amaçlarıyla sunulur. cTrader Store bir broker değildir ve yatırım tavsiyesi, kişisel öneriler vermez veya gelecekteki performansı garanti etmez.

Bu oluşturanın diğer ürünleri

"ORB_Dashboard" logosu
En yüksek puanlı
4.5
(7)
$25
Gösterge
Signal
Trades Opening Range Breakouts Indicator with dynamic stops/targets adapting to market volatility.

Şunları da beğenebilirsiniz

Gösterge
Liquidity Grab
Liquidity Sweep
+2
Visualizes accumulation ranges, manipulation sweeps and distribution phases on your cTrader chart.
Gösterge
SMC
Prop
+12
SMC Pro Suite: OBs, FVGs, Structure, Liquidity, Killzones & MTF overlay. Every concept in one cTrader indicator.
Gösterge
EMA
Forex
+5
ALMA Smoothed Gaussian Moving Average (ASGMA) – by LudwigICT
Gösterge
RSI
Forex
+7
Advanced S/R + liquidity zone detector with auto-configured trade styles. Generates filtered entry signals with TP/SL.
Gösterge
ATR
SMC
+18
Precision SMC tool with HTF sweeps, MSS confirmation & smart FVG detection for high-probability reversals.
Gösterge
Prop
Forex
+4
Risk Reward Management Tools(风险回报管理工具)
Gösterge
RSI
Breakout
+1
📊 Liquidation Map: Potential areas where highly leveraged investors might face liquidations.
Gösterge
Imbalance
Key Levels
+2
A Next-Generation Adaptive Oscillator with Z-Score Regime Engine.
"Cross EMA Pro" logosu
En yüksek puanlı
4.4
(5)
$49
Gösterge
Forex
BTCUSD
+5
Cross EMA Pro – Trend Reversal Indicator
Gösterge
Prop
Institution-level trend Analyzer.
Gösterge
ATR
Forex
+9
Auto-detect swing highs/lows. Spot reversals, map structure, and filter noise with adjustable strength.
Gösterge
ATR
RSI
+5
One of the best indicators we have ever developed, with a very high profit ratio.
Gösterge
MSS
Inducement
+5
ICT Core is a non-repainting Smart Money Concepts indicator
Gösterge
ATR
EMA
+4
SCALPING M1 CTRADER v1.0 — Institutional-Grade M1 Gold & Forex Scalping System
Gösterge
Forex
BTCUSD
+5
Daily/Weekly/Monthly - Highs & Lows Indicator (Customizable Settings)
Gösterge
EMA
Plots one value from -1 to +1 blending an EMA trend score with a mean-reversion state by volatility regime.
Gösterge
Forex
Crypto
+5
Volume Imbalance Bars Indicator - brings institutional-grade market microstructure analysis to cTrader.
Gösterge
BOS
Order Block
+3
Not every order block deserves your attention.

Fiyat

Başlangıç 23/04/2025
36.31M
İşlem hacmi
4.69K
Kazanılan pip
3
Satışlar