

Açıklama
Bu, cTrader platformunda veri görselleştirme için tasarlanmış profesyonel düzeyde çoklu zaman dilimli (MTF) bir piyasa analiz aracıdır. Altın (XAU/USD), endeksler veya BTC gibi varlıklar için yapısal bölgelerin haritalanmasını, çoklu zaman dilimli yapısal yönsel eğilimi, seans zamanlamasını ve mum çubuğu desen tanımlamasını otomatikleştirerek nesnel, kurallara dayalı piyasa analizi sunar.
1. Analiz Edilen Piyasa Verileri ve Koşulları
Araç, yapısal piyasa koşullarını değerlendirmek için çok katmanlı canlı tik ve tarihsel verileri işler:
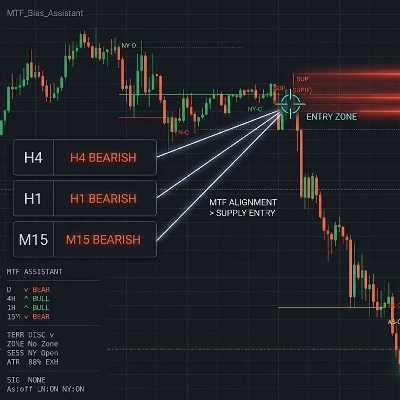
- Çoklu Zaman Dilimli Yönsel Eğilim: Fiyatı dört farklı ufukta eşzamanlı olarak yapısal seviyelere göre değerlendirir: Günlük, 4 Saat (H4), 1 Saat (H1) ve 15 Dakika (M15).
- Piyasa Yapısı ve Değeri: Günün ortalama noktası (Denge - EQ) hesaplanarak göreceli indirim ve prim fiyat pozisyonlarını belirler. Salınım pivotları ve İmpuls genişlemeleri kullanarak piyasa yapısı değişimlerini tarar.
- Dengesizlik Takibi: Yapısal dengesizliklere bağlı Adil Değer Boşluklarının (FVG) varlığını tespit ederek yer değiştirmeyi belirler.
- Volatilite Takibi: Günlük mevcut aralığı 14 günlük Ortalama Gerçek Aralık (ATR) ile karşılaştırarak istatistiksel aşırı genişlemeyi belirler.
- Zamansal Filtreler: Kesin UTC sınırlarıyla ana küresel ticaret seanslarını tanımlar: Asya Açılışı, Londra ve New York Açılışı.
2. Görsel Öğeler ve Analitik Yorum
Grafikteki görsel öğeler, fiyatın tarihsel olarak etkileşimde bulunduğu yapısal alanları haritalar:
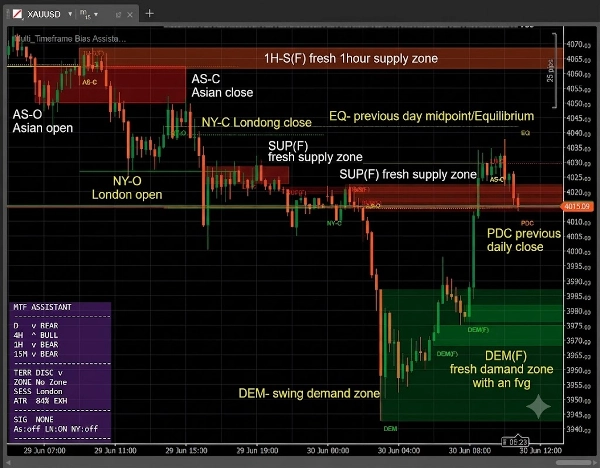
- Yapısal Bölgeler: Renkli kutular olarak gösterilir. Standart talep bölgeleri yeşil dolgu ve yeşil sınır ile; H1 talep bölgeleri mavi/cyan olarak görüntülenir. Standart arz bölgeleri kırmızı dolgu ile; H1 arz bölgeleri turuncu olarak gösterilir.
- Günlük Referans Çizgileri: PDO (Önceki Günlük Açılış) beyaz dolu çizgi olarak; PDC (Önceki Günlük Kapanış) turuncu çizgi olarak; Günlük EQ (Denge) ise günlük aralığın %50 geri çekilmesini takip eden sarı çizgi olarak gösterilir.
- Seans Açılış İşaretçileri: Seans açılışlarını gösteren renkli yatay çizgiler (Asya için Sarı, Londra için Kırmızı, New York için Yeşil).
Kesişim
- Kesişim Kontrol Paneli: Kullanıcı tanımlı teknik kriterler eşzamanlı olarak hizalandığında kontrol panelinde görsel bir matris gösterir. Örneğin, fiyat Günlük Denge'nin altındaki taze bir talep bölgesiyle etkileşime girdiğinde ve daha yüksek zaman dilimli yapılar pozitif yönde hizalandığında Boğa hizalaması durumu vurgulanır.
3. Ana Ayarlar ve Parametreler
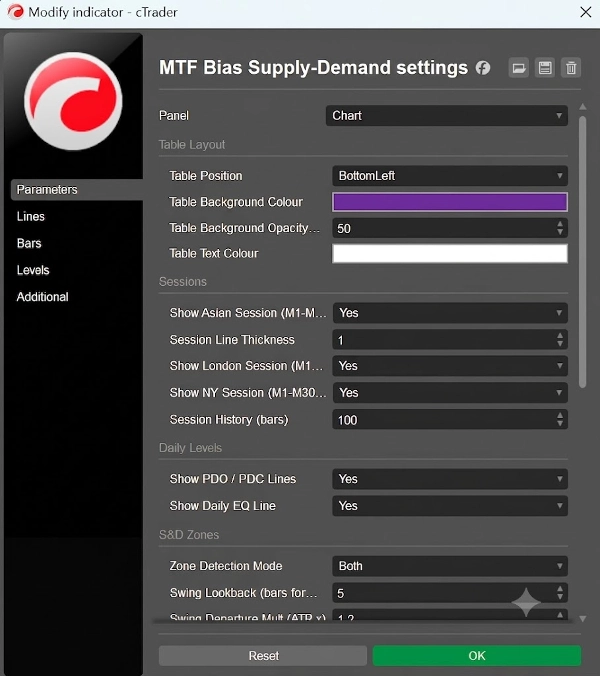
- Bölge Algılama Modu (Sadece Salınım, Sadece İmpuls veya Her İkisi): Yapısal bölgeleri tanımlamak için kullanılan matematiksel mantığı belirler.
- FVG Gereksinimi (Doğru/Yanlış): Etkinleştirildiğinde, bölgeler yalnızca onaylanmış bir Adil Değer Boşluğu dengesizliği ile birlikte çizilir.
- Bölge Yeniden Test Maksimum: Bir bölgenin grafikten silinmeden önce kaç kez test edilebileceğini tanımlar. Bunu 0 olarak ayarlamak, bölgeyi ilk dokunuşta hemen kaldırır.
- Günlük ATR Tüketim % (AtrLimit): Varsayılan 0.80 ( %80). Varlık ortalama günlük aralığının %80'inden fazlasını hareket ettirmişse genişleme tükenişini vurgulayan bir filtreleme mekanizması sağlar.
4. Teknik İş Akışı Örneği
Piyasa açılışları sırasında bir grafik izlenirken, araç eşzamanlı teknik faktörleri göstermek için verileri işler. Daha yüksek zaman dilimli matris boğa yapısal hizalaması gösteriyorsa ve fiyat daha sonra Günlük Denge çizgisinin altına inip bir H1 talep bölgesine girerse, arayüz PIN etiketi çizer ve kontrol paneli durumunu günceller. Bu, kullanıcıya önceden yapılandırılmış kurallar setlerinin düzenli, görsel bir özetini doğrudan arayüzde sağlar.
5. Hedef Kullanıcı Profili
- Deneyim Seviyesi: Orta ile İleri arasında.
- Analitik Stil: Sistem tabanlı analiz, çoklu zaman dilimli yapısal haritalama ve seans hacmi takibi.
- Stratejik Uyumluluk: Sistematik fiyat hareketi modelleri, yapısal arz/talep çerçeveleri veya çoklu zaman dilimli korelasyon modelleri uygulayıcıları için tasarlanmıştır.
6. Sınırlamalar ve Kullanım Notları
- Zaman Dilimi Görünürlük Matrisi: Grafik netliğini korumak için yerleşik bir görünürlük filtresi içerir. Daha düşük zaman dilimli bölgeler ve mikro desenler yalnızca yürütme görünümlerinde (M1 ile M15 arası) sınırlıdır. Seans çizgileri otomatik olarak M30 görünümünün üzerinde gizlenir ve H1 bölgeleri H1 görünümünün üzerinde gizlenir.
- Sabit UTC Seans Saatleri: Seans sınırı takibi doğrudan sabit UTC saatlerine göre haritalanır (Asya: 00:00-07:00, Londra: 07:00-16:00, NY: 12:00-21:00). Broker sunucu saatleri standart UTC'den farklıysa ayarlar manuel olarak ayarlanmalıdır.
- Otomatik Yeniden Test Budaması:
ZoneRetestMax = 0olduğunda, küçük bir likidite fitili bölge tanımını ekrandan kaldırır. Kullanıcılar, anlık dokunuşlar ile sürekli hafifletme blokları arasındaki tercihlerine göre bu ayarı kalibre etmelidir.
Özet
Visual elements include color-coded structural zones (demand and supply), daily reference lines (previous open, close, and equilibrium), and session open markers for Asian, London, and New York trading sessions. A confluence dashboard highlights when multiple technical criteria align, aiding systematic analysis.
Key configurable settings allow users to define zone detection logic, require Fair Value Gap confirmation, limit zone retests, and filter signals based on daily ATR consumption. The indicator supports intermediate to advanced traders employing systematic price action, supply/demand frameworks, or multi-timeframe correlation strategies. Timeframe visibility filters and fixed UTC session clocks help maintain chart clarity and session accuracy.

















