CandleThemeX
Indicateur
Version 1.0, Sep 2025
Windows, Mac
4.0
Avis : 2
Description
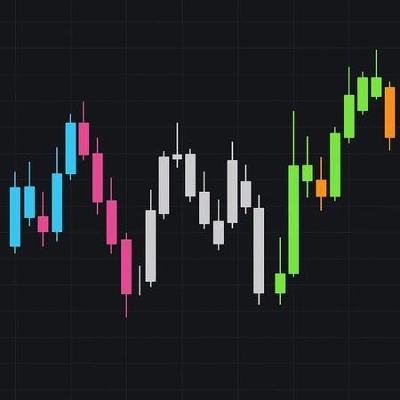
couleur pour , en la personnalisant
- Bleu clair & Rose : Bleu clair pour
- Gris & Blanc : Tons neutres,
- Vert néon & Orange :
Résumé
Profil de l'indicateur
Avis clients
4.0
Avis : 2
5 | 0 % | |
4 | 100 % | |
3 | 0 % | |
2 | 0 % | |
1 | 0 % |
Discussion
Questions fréquentes
Les produits disponibles sur cTrader Store, notamment les bots de trading, les indicateurs et les plug-ins, sont fournis par des développeurs tiers et mis à disposition à titre informatif et à des fins d'accès technique uniquement. cTrader Store n'est pas un courtier et ne fournit aucun conseil en investissement, aucune recommandation personnelle ni aucune garantie quant aux performances futures.


![Logo de "Smart Money Concepts (SMC) [Iridio Capital]"](https://cdn.ctrader.com/image/webp/28b69fd1-ef54-4bed-9487-07e78e883be4_40934)


Prix
Depuis le 13/05/2025
121.42M
Volume tradé
13.93K
Pips gagnés